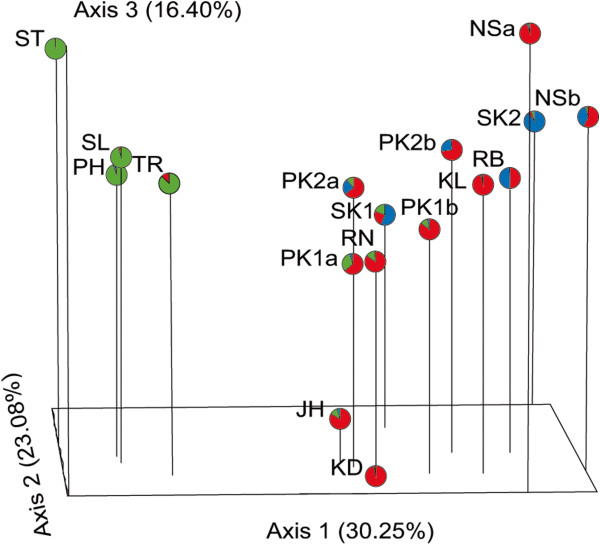
Figure 4.

Principle Coordinate Analysis (PCoA) in three-dimensional plot. The planes of the first three principal coordinates explain 30.25%, 23.08%, and 16.40% of total genetic variation, respectively. The pie graph represents the average co-ancestry distribution of 379 individuals in three hypothetical clusters (K = 3).
