
Figure 4.
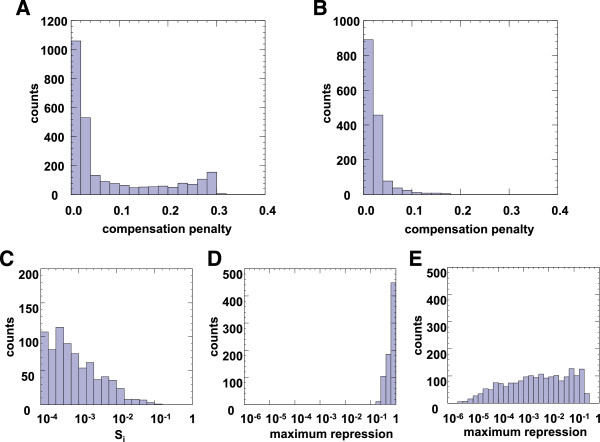
Sufficiency analysis of the network-dosage compensation conditions. A-B. Histogram of compensation penalty of networks with inducibility penalty < = 0.1 and constrained parameter value between 0.9 and 1.1, for the topology shown in Figure 1B (A) and Figure 1C (B). C. Values of Si for networks in part A with compensation penalty > 0.1. D. Maximum steady state repression in networks with high compensation penalties. Value of 1 means no repression; smaller value means stronger repression. E. Maximum steady state repression in dosage compensated networks.