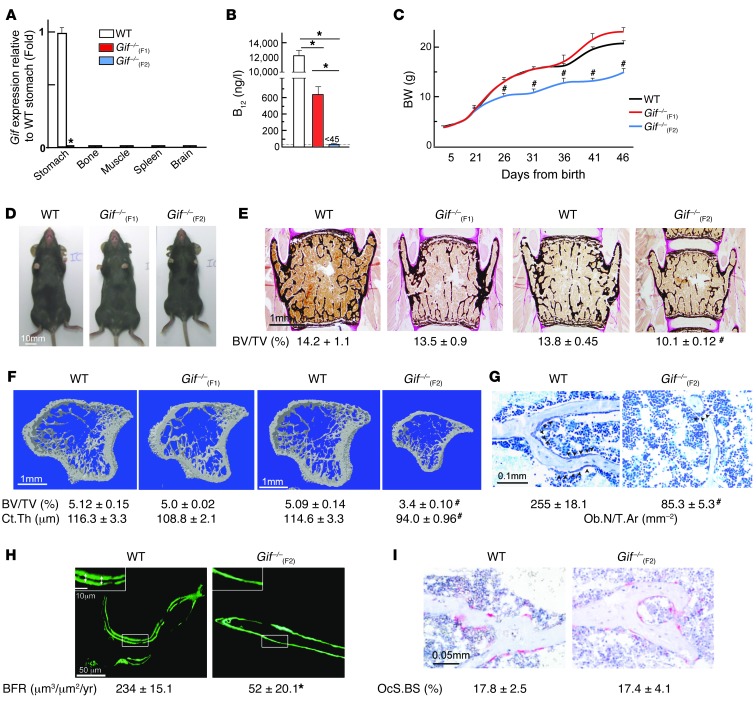
Figure 1. B12 deficiency in mice causes growth retardation and low bone mass.
(A) Real-time PCR analysis of Gif expression in WT and Gif–/– tissues. (B) Serum B12 levels in WT, Gif–/–(F1), and Gif–/–(F2) mice. (C) BW analysis of WT, Gif–/–(F1) and Gif–/–(F2) mice. (D) Morphological analysis of 8-week-old WT, Gif–/–(F1), and Gif–/–(F2) mice. (E and F) Histological analysis of vertebrae (E) and μCT analysis of long bone (F) of WT, Gif–/–(F1), and Gif–/–(F2) mice. Mineralized bone matrix (black) was stained by von Kossa reagent. BV/TV, bone volume relative to total volume. Ct.Th., cortical thickness. (G) Toluidine blue staining showing reduced osteoblast number on bone surface, with quantification of Ob.N/T.Ar. (H) Photomicrographs showing near-absence of calcein double labeling on the surface of trabecular bone in Gif–/–(F2) mice, with quantification of BFR. (I) Photomicrographs showing TRAP-stained osteoclasts on the bone surface (pink), with quantification of osteoclast surface per bone surface (OcS/BS). #P < 0.05; *P < 0.01. Values are mean ± SEM. n = 8 [WT and Gif–/–(F2)]; 9 [Gif–/–(F2)]. Arrowheads on images indicate the location of cell types or parameters measured. Scale bars: 10 mm (D); 1 mm (E and F); 0.1 mm (G); 50 μm (H); 10 μm (H, insets); 0.05 mm (I). See also Supplemental Figure 1.

