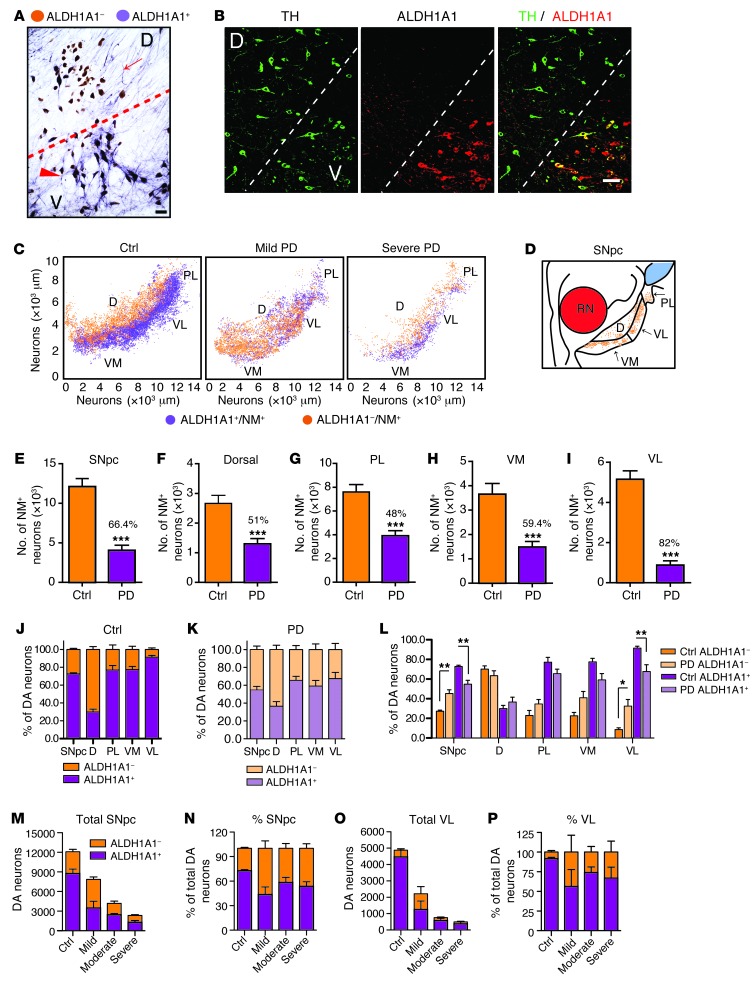
Figure 3. ALDH1A1-positive DA neurons exhibit a conserved topographic distribution in human SNpc and show reduction of ALDH1A1 expression in PD.
(A) Representative bright-field image shows ALDH1A1 staining (purple) in SNpc transverse sections of control human brains. Nigrostriatal DA neurons (dark brown) were marked by the presence of NM in the soma. Arrow points to a cluster of ALDH1A1-negative DA neurons in the dorsal tier of SNpc. Arrowhead indicates a group of ALDH1A1-positive DA neurons in the ventral tier of SNpc. (B) Representative fluorescent images show TH and ALDH1A1 costaining in the transverse section of SNpc in control human brains. (C) 3D reconstruction of DA neurons in human SNpc shows the distribution of ALDH1A1 and NM double-positive (purple) as well as ALDH1A1-negative/NM-positive (brown) neurons remaining in the SNpc of control (Ctrl) and PD human brains. (D) Sketch of transverse section of human SNpc. RN, red nucleus. (E–I) Remaining DA neurons in the (E) SNpc, (F) dorsal, (G) PL, (H) VM, and (I) VL parts of control (n = 9) and PD (n = 10) brains. Numbers over the PD bars show the percentage of DA neuron loss compared with the controls. (J and K) Percentages of ALDH1A1+/NM+ and ALDH1A1–/NM+ DA neurons in SNpc, dorsal, PL, VM, and VL parts of (J) control human (n = 9) and (K) PD cases (n = 10). (L) Percentages of ALDH1A1+/NM+ and ALDH1A1–/NM+ DA neurons in SNpc, dorsal, PL, VM, and VL parts of control (n = 9) and PD cases (n = 10). (M–P) Total number and percentage of ALDH1A1+ and ALDH1A1–/NM+ neurons in the (M and N) SNpc and (O and P) VL subregion of control, mild, moderate, and severe PD cases. Scale bar: 70 μm (A); 100 μm (B). *P < 0.05, **P < 0.01, ***P < 0.001.

