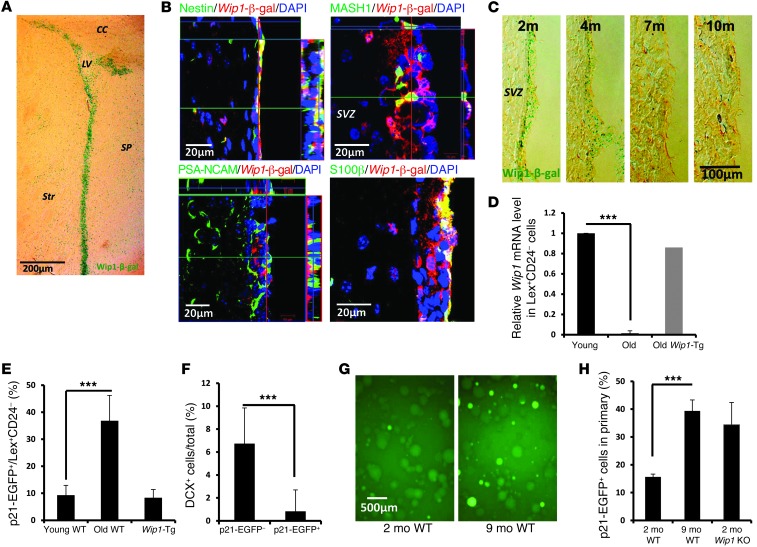
Figure 1. Expression of WIP1 in NSCs and p53 activation during aging.
(A) Representative image of β-gal staining of brains of Wip1-β-gal mice. LV, lateral ventricle; CC, corpus callosum; Str, stratum; SP, septum. (B) Representative photographs of colocalization analysis of Wip1-β-gal and NESTIN, MASH1, PSA-NCAM, and S100β. Note Wip1-β-gal expression in NSCs and transit-amplifying cells but not in neuroblasts. (C) Representative images of Wip1-β-gal in the SVZ regions of 2-, 4-, 7-, and 10-month-old mice. (D) Real-time PCR analysis of Wip1 mRNA in sorted LeX+CD24– SVZ cells from 2- to 3-month-old (young) and 1-year-old (old) WT mice as well as from 1-year-old Wip1-Tg mice. The gate for sorting is shown in Supplemental Figure 1D. Data are mean ± SD. (E) Analysis of EGFP signals from p21 promoter in LeX+CD24– SVZ cells obtained from 2- to 3-month-old and 1-year-old WT mice as well as from 1-year-old Wip1-Tg mice. Detailed analysis is shown in Supplemental Figure 1G. Data are mean ± SEM. (F) Quantification of percentages of DCX-positive cells after 2 days differentiation for p21-EGFP–positive and –negative cells. Data are mean ± SD. (G) Representative images of primary NSPs isolated from 2- and 9-month-old p21-EGFP reporter mice. (H) Quantification of the percentages of p21-EGFP–positive cells in primary neurospheres isolated from 2- and 9-month-old WT mice and 2-month-old Wip1 KO mice. Data are mean ± SEM. ***P < 0.005. Scale bar: 200 μm (A); 20 μm (B); 100 μm (C); 500 μm (G).

