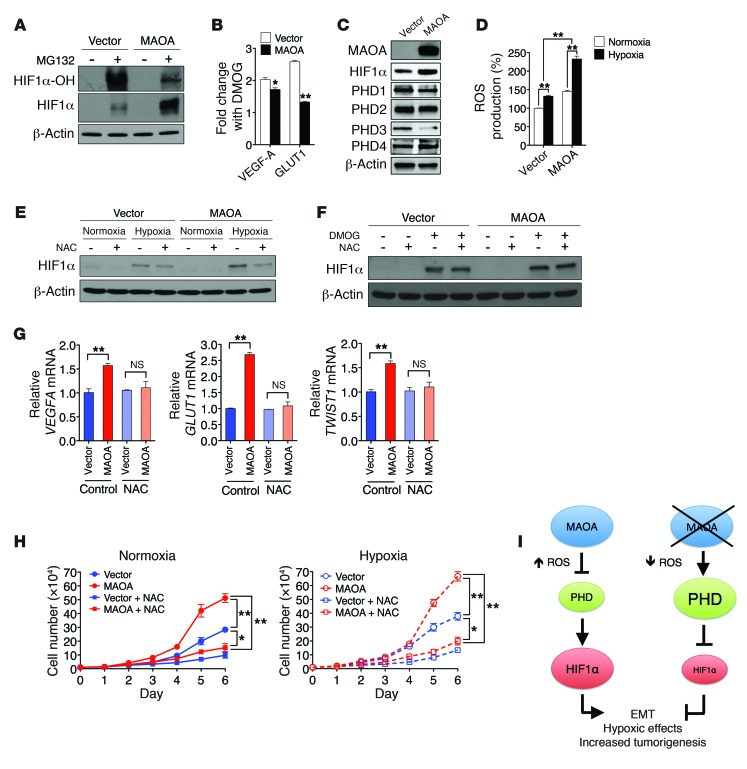
Figure 3. MAOA regulates HIF1α stability through ROS.
(A) Immunoblots of PC-3 (vector and MAOA-overexpression) cells treated with or without MG132 (1 μM, 6 hours) for hydroxylated HIF1α (HIF1α-OH) and total HIF1α. (B) Fold induction of HIF1α target genes in PC-3 (vector and MAOA-overexpression) cells treated with DMOG (1 mM, 24 hours) was measured by qPCR, and the ratio (mean ± SEM, n = 3) of DMOG-treated to untreated gene expression is shown. *P < 0.05, **P < 0.01. (C) Immunoblots of PC-3 (vector and MAOA-overexpression) cells with hypoxia for PHD1–4. (D) The increase in ROS production in PC-3 (vector and MAOA-overexpression) cells with hypoxia was calculated as the percentage changes (mean ± SEM, n = 3) in ROS levels in hypoxic cells relative to normoxic cells. **P < 0.01. (E) Immunoblots of PC-3 (vector and MAOA-overexpression) cells incubated with 10 mM NAC and cultured under normoxia and hypoxia. (F) Immunoblots of PC-3 (vector and MAOA-overexpression) cells cultured at 21% O2 with 10 mM NAC or 1 mM DMOG as indicated. (G) qPCR analysis of VEGFA, GLUT1, and TWIST1 expression (mean ± SEM, n = 3) in PC-3 (vector and MAOA-overexpression) cells incubated with 10 mM NAC and cultured under hypoxia. **P < 0.01. (H) Growth curves of PC-3 (vector and MAOA-overexpression) cells cultured in standard media supplemented or not supplemented with 10 mM NAC under either normoxia (left panel) or hypoxia (right panel) (mean ± SEM, n = 3). *P < 0.05, **P < 0.01. (I) A schematic diagram outlining MAOA stabilization of HIF1α by repression of PHD activity through ROS production.

