Figure 3.
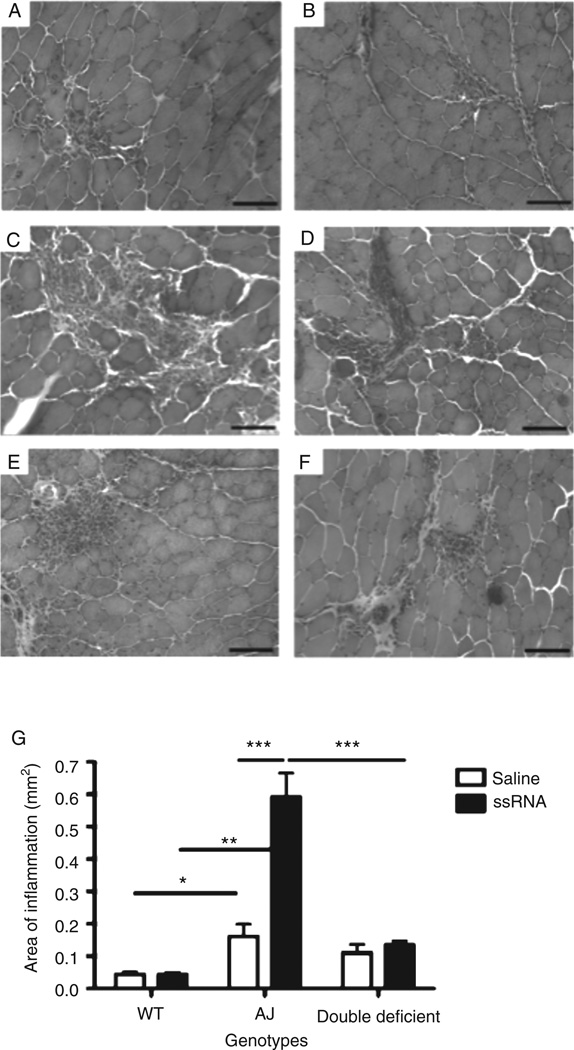
Quantitation of mononuclear cell infiltrates in the H&E-stained sections of WT, A/J, and double-deficient mice. Representative H&E-stained transverse sections from ssRNA-injected (A: WT; C: A/J; E: double-deficient) and saline-injected (B: WT; D: A/J; F: double-deficient) TA muscles. (G) Quantitation of the inflammatory area in muscle sections injected with either ssRNA or saline in WT, A/J, and double-deficient mice. Data are expressed as means ± SEM (n = 4 animals from each treatment and genotype). *p ≤ 0.05, **p ≤ 0.01, and ***p ≤ 0.001; unpaired Student’s t-test for comparisons indicated by lines above the bars. Bar=200 µm.

