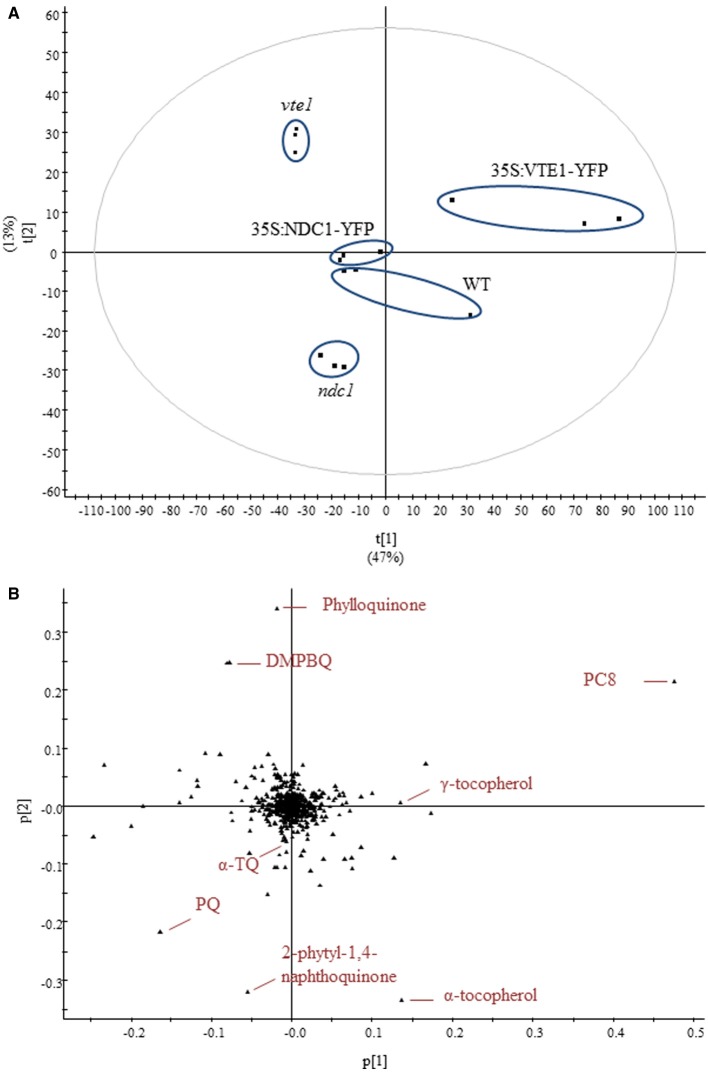
Figure 3.
Untargeted lipidomics showing differences in lipid profiles between five different genotypes under moderate light conditions. (A) Principal component analysis. (B) Corresponding loadings plot. Lipids were extracted from WT, ndc1, vte1, 35S:NDC1-YFP and 35S:VTE1-YFP plants. Data are means of three experiments (n = 3).

