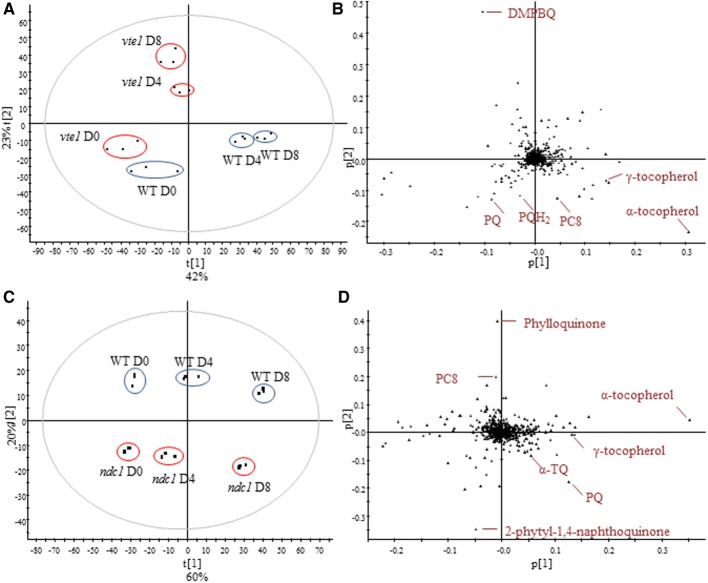
Figure 4.
Comparison of the lipid profile between WT and vte1 or ndc1 mutant plants and after HL stress. (A) Principal component analysis showing difference between WT and vte1 and (B) corresponding loadings plot. (C) Principal component analysis showing difference between WT and ndc1 and (D) corresponding loadings plot. Plants grown under moderate light conditions (D0) were exposed to continuous HL (500 μE m−2 s−1) for 4 (D4) and 8 days (D8). Data are means of three experiments (n = 3).

