
Figure 5.
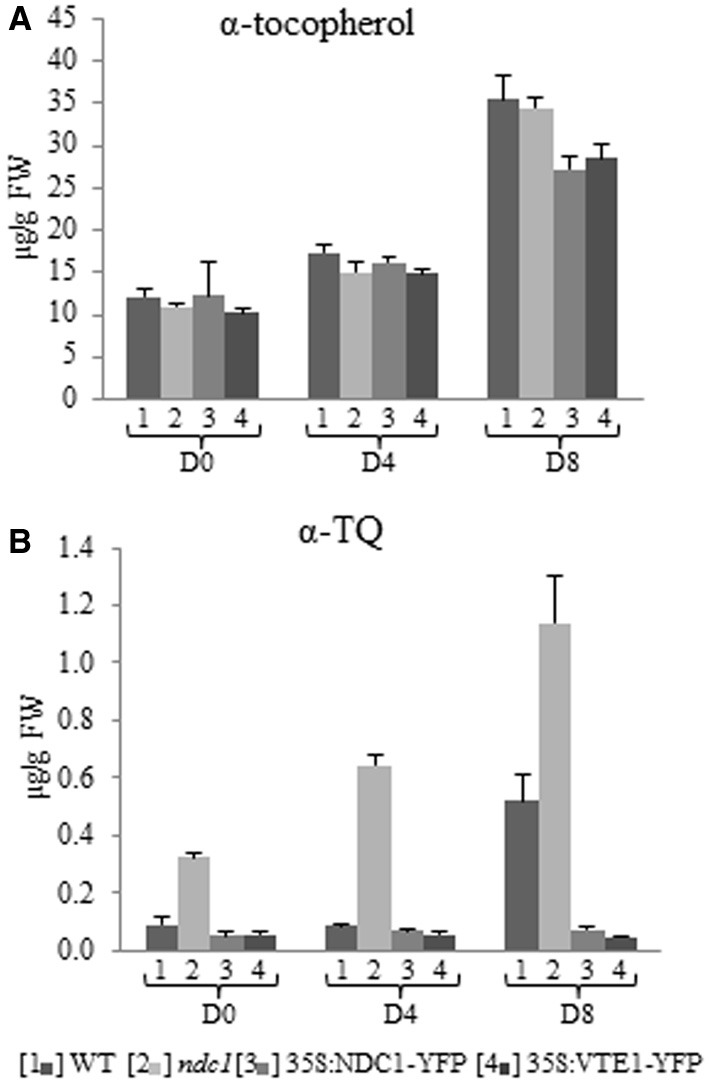
α-tocopherol and α-tocopherol quinone quantification in leaf and after HL treatment. (A) α-tocopherol. (B) α-tocopherol quinone. Lipids were extracted from [1] WT, [2] ndc1, [3] 35S:NDC1-YFP, and [4] 35S:VTE1-YFP plants and quantified using purified standards. Plants grown under moderate light conditions (D0) were exposed to continuous HL (500 μE m-2 s-1) for 4 (D4) and 8 days (D8). Data are means of three experiments (n = 3).