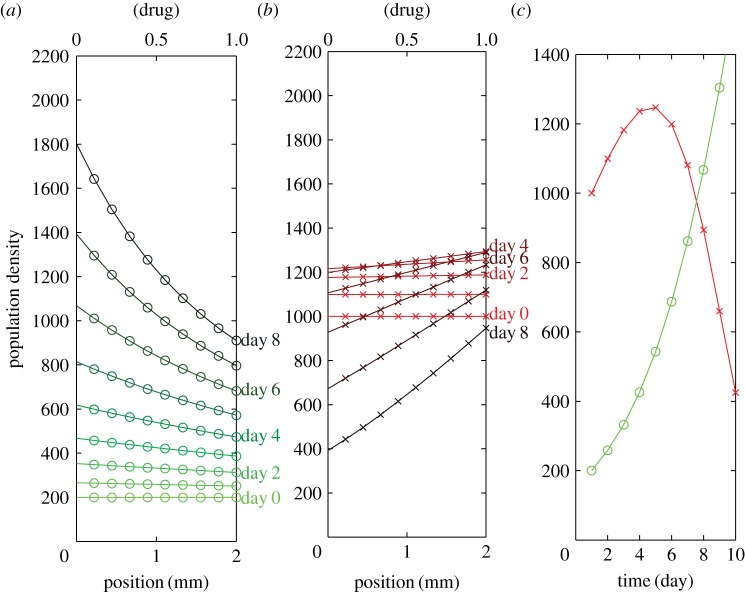
Figure 4.
Model prediction of the MM-rich population distribution within the doxorubicin gradient. (a) ST population distribution versus time (from light green to dark green). Initial condition: uniform distribution of 200 cells 4 mm−2. (b) MM population distribution versus time (from light red to dark red). Initial condition: uniform distribution of 1000 cells 4 mm−2. (c) Total MM (red) and ST (green) population versus time.

