

Abstract
One of the predictions of game theory is that cooperative behaviours are vulnerable to exploitation by selfish individuals, but this result seemingly contradicts the survival of cooperation observed in nature. In this review, we will introduce game theoretical concepts that lead to this conclusion and show how the spatial competition dynamics between microorganisms can be used to model the survival and maintenance of cooperation. In particular, we focus on how Escherichia coli bacteria with a growth advantage in stationary phase (GASP) phenotype maintain a proliferative phenotype when faced with overcrowding to gain a fitness advantage over wild-type populations. We review recent experimental approaches studying the growth dynamics of competing GASP and wild-type strains of E. coli inside interconnected microfabricated habitats and use a game theoretical approach to analyse the observed inter-species interactions. We describe how the use of evolutionary game theory and the ideal free distribution accurately models the spatial distribution of cooperative and selfish individuals in spatially heterogeneous environments. Using bacteria as a model system of cooperative and selfish behaviours may lead to a better understanding of the competition dynamics of other organisms—including tumour–host interactions during cancer development and metastasis.
Keywords: game theory, bacteria, Prisoner's Dilemma
1. Introduction
When two individuals, autonomous agents or even countries interact, the outcome varies greatly depending on the intention of each party involved. Early attempts to quantify these interactions resulted in what is now called game theory [1]: a mathematical framework describing the outcome (pay-off) resulting from specific interactions (game) between two individuals (players). In particular, game theory describes how the interaction between two players incurs a specific—and not necessarily symmetrical—pay-off to each one, and the behaviour of each player dictates how each benefits from those interactions. Although it may seem unnatural to reduce complex sociological or political interactions to a simple numerical value, game theory does provide a rational and quantitative framework to quantify complex interactions [2,3].
Parallel to this, game theory has also been used in a biological context [4,5] to quantify interactions between living organisms and to describe the population dynamics of competing populations. One of the main results of game theory when applied to competing individuals is that cooperation, defined here as a behaviour which benefits the whole population, is typically at a disadvantage with respect to selfish behaviours [6,7]. Indeed, interactions where cooperative actions can be taken advantage of and exploited by self-serving individuals provide a means for selfish behaviours to emerge within a population: the demise of cooperation usually stems from the exploitative nature of selfish behaviours, which redirect resources away from cooperators. For example, game theory can model the emergence and dominance of selfish tumour cells, which abandon the social contract of multicellular organisms to venture into unicellularity and self-serving behaviours [8–10].
On the other hand, the observation that cooperation is widespread—expressed as mutlicellularity, efficient public good management or indeed any functioning society—seems to contradict this fundamental result. Several theoretical explanations have been proposed to explain this [11–14] and, more recently, biological experiments in which selfish individuals spread within a population [15–18] have provided significant insight into the strategies used (or not used) by cooperative individuals when faced with selfish competitors.
In this review, we focus exclusively on an experimental system first described in [19] and subsequently used in [15,16,18,20], consisting of interconnected microfluidic chambers called micro-habitat patches in which we can create heterogeneous spatial environments and observe competing bacterial strains. The competitors are (i) wild-type (WT) Escherichia coli cells and (ii) a mutant strain of E. coli that displays a growth advantage in stationary phase (GASP) [21], which has previously been shown to use selfish behaviours to exploit WT populations [22]. We believe that, by understanding the dynamics of competing bacteria, significant insight can be gained about the survival and maintenance of cooperation in natural environments, and may help develop new treatment strategies against tumour cells and cancer tissue during metastasis.
2. Game theory in biology
2.1. Equilibrium and optimal strategies
Antoine Augustin Cournot first described in 1838 how firms in a duopoly can maximize their profit (i.e. pay-off) in what would now be called a game theoretical approach [23]. He described how a strategy that maximizes the profit of all firms exists, and that any deviations from this optimal strategy lead to a diminished return for all firms. Cournot's approach was later shown to be a subset of a more general framework developed by John von Neumann, John Nash and co-workers [1,24]. One important result is that some of these games have a Nash equilibrium, which represents the state where every player uses a strategy that maximizes his or her pay-off while taking into account the strategy of other players. The theory is especially well fleshed out for two-player games where the outcome of each interaction can be quantified, and the ‘quality’ of these interactions is usually presented in the form of a pay-off matrix. An example of a pay-off matrix is shown in table 1, where each player may choose to cooperate or defect, and the result of each interaction is associated with a pay-off. Knowing each player's options, and assuming that each one acts rationally, a Nash equilibrium may be found that describes the set of strategies that optimize the pay-off for each player.
Table 1.
Pay-off matrix of a two-player game. In a game where each player can use one of two strategies (cooperation or defection), each player is awarded a pay-off that depends on the strategy of the other player. The relationship between each element of the pay-off matrix (R, S, T, P) dictates the type of game that is being played. R, reward, S, sucker's pay-off, T, temptation, P, punishment.
| player 1/player 2 | cooperates | defects |
|---|---|---|
| cooperates | (R, R) | (S, T) |
| defects | (T, S) | (P, P) |
A Nash equilibrium does not necessarily represent the maximum pay-off possible: a famous instance of a Nash equilibrium that results in a non-maximal pay-off for each player is the Prisoner's Dilemma (PD). The PD describes the type of game which satisfies the condition T > R > P > S (table 1). Although both players may obtain a higher pay-off from cooperating (pay-off R > P), the Nash equilibrium actually dictates that each player defects owing to the potentially large penalty incurred if one cooperated and the other one is tempted to defect  . The PD is a canonical example of the rise and fall of cooperation: cooperation, which would result in a higher pay-off to each individual, is not the optimal strategy. Instead, selfishness is favoured even though it incurs a higher cost to each individual.
This type of conflicting situation is not limited to a PD game; another situation which favours the maintenance of selfishness is the hawk–dove game (also called a chicken or snowdrift game), which describes a pay-off matrix that satisfies the condition T > R > S > P. Here, the symmetric Nash equilibrium is either a pure strategy, where all the players either defect or cooperate (trivial initial conditions), or a mixed equilibrium, where each player probabilistically chooses between cooperation and defection with probability  and
and  . In either case, unconditional cooperation by both players, perhaps a more ‘just’ and less harmful strategy overall, is not the optimal strategy.
2.2. Evolutionary game theory and replicator dynamics
A modified form of game theory called evolutionary game theory (EGT) can be used to describe the effect of every interaction between competing individuals within a population and describe the long-term population dynamics of competing populations. While game theory describes the strategy of two players as a probabilistic combination of pure strategies (and the Nash equilibrium describing the probability of the use of each strategy), EGT tracks the strategies used by a population of players. Here, the pay-off matrix of a given set of interactions is given by the fitness gained or lost upon encounters of different individuals. The optimal strategy used by each player within the population that is stable upon the introduction of a new player is defined as an evolutionary stable strategy (ESS) [25].
EGT can also involve pay-offs which are density dependent; in other words, the outcome of an interaction between individuals within a population depends on the overall population size. The extension of EGT to density-dependent pay-offs combines a game theoretical approach with the ideal free distribution (IFD) [26], an ecological framework which describes how density-dependent effects can affect the fitness (pay-off) of individuals. Such systems, studied in [27–30], can accurately describe the competition dynamics of interacting populations of fixed size under resource limitations, and results have shown that they give rise to equilibrium distributions which are stable under small spatial perturbations [31]. While the rest of this section only involves competition dynamics of two competing populations using constant pay-offs, the effect of density-dependent pay-offs will be addressed in the last section of this article.
The time evolution of two competing populations of cooperator and defectors, expressed in term of replicator dynamics and density-independent pay-offs [32–34], is given by
| 2.1 |
where the population fraction of each population is given by xc and xd, respectively, and fc and fd denote the frequency-dependent fitness of each population that depend on the matrix wij describing the system, where each element i, j describes the fitness associated with each interaction between player i and j. Here, each fi is given by
| 2.2 |
Replicator dynamics imply that individuals do not change strategy over time (i.e. each player uses a pure strategy), so each phenotype constitutes a different strategy and the frequency at which new strategies emerge is limited by the mutation rate. The steady-state distributions of the cooperative population is given by
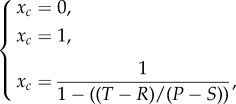 |
2.3 |
and corresponds to either pure populations (xc = 0 or xc = 1) or a stable mixture of two populations, provided that 0 < xc < 1. Not all of those distributions are dynamically stable, and the set of conditions that allow cooperators to survive are summarized in figure 1. Generally, a population of selfish individuals will always be present within the population whenever a temptation to defect (T > R) or a pay-off to cooperators has the potential to be lowered through interactions with defector populations (P > S).
Figure 1.

Game theory. A pay-off matrix describes the nature of the interactions between two players. Two important variables are the temptation to cheat (T–R), which is the difference between the ‘temptation’ to defect and the ‘reward’ obtained by cooperating, and the penalty incurred by cooperating (P–S), which measures the pay-off when the other player cheats. In the middle panel, equation (2.1) is solved and the final fraction of cooperator xc(t) as t → ∞ is computed. The colourbar illustrates the value of xc(∞), the fraction of cooperative individuals within the population at equilibrium, and a few examples of competition between individuals are shown in panels (a–d).
If this analysis is applied to the hawk–dove game (figure 1), interactions will always favour coexistence between cooperating and defecting populations, regardless of the initial population composition (provided that at least one cooperator and one defector is present). On the other hand, certain conditions—such as low temptation to cheat (T < R) and low penalty for cooperating (P < S), labelled harmony in figure 1—favour harmonious interactions and the complete dominance of cooperative populations.
Another type of game called the stag-hunt game describes situations which satisfy the general requirement R > T ≥ P > S. In this case, the temptation to defect is low but a selfish individual is at an advantageous position with regard to a cooperating individual: the stag-hunt game may lead to a predominance of the selfish population, but only under certain conditions (figure 1b,c). The likelihood that a cooperator population survives, however, is tied to its initial fraction in the population: for a given set of (T − R) and (P − S) parameters, the cooperator population is more likely to survive when it is initially present at a higher initial fraction within a population (figure 1b,c).
On the other hand, EGT applied to the PD never allows a mixed population to survive, and every PD game generally leads to a complete extinction of the cooperator population. Therein lies the big conundrum of game theory: how is cooperation ever expected to occur if it is always at a disadvantageous position in the face of selfishness? Although a stable population of cooperating individuals can subsist, they will have to continually face defector populations that divert resources and exploit cooperative individuals. Furthermore, elements of the pay-off matrix may not be stable over time and, if the conditions happen to change favourably towards defection (i.e. (T − R) and/or (P − S) increases), the relative fraction of players using a cooperative strategy will either decrease (hawk–dove game) or have a higher probability to become extinct (stag-hunt game). Harmony and a complete removal of selfish behaviours within a population—for example, a perfectly functioning society or a complete remission following cancer treatments—fails to occur unless interactions between players obey a relatively narrow set of conditions for which both the temptation to cheat and the penalty for cooperating are low.
3. The players: GASP versus WT Escherichia coli bacteria
Bacteria are very rarely in an exponential growth state in natural environments, and cells have to use a variety of strategies in order to survive in resource-limited environments [35]. For instance, the carbon levels in oceans are approximately 50 μM [36], compared with the 0.1 M found in a typical laboratory-made growth medium. Similarly, bacteria in the soil go through an estimated 36 generations a year owing to the highly limited bio-availability of energy [37]. These limitations are present in most bacterial systems found in nature.
In E. coli, WT cells growing in a new environment will slowly consume the available nutrients and produce metabolic by-products. Then, in response to deteriorating growth conditions, the cell population will cease to proliferate and enter a state called stationary phase [38]. The response to such deteriorating conditions is via a phenotypic switch regulated by the σs sigma factor, transcribed by the rpoS gene [39]. This sigma factor triggers the expression of several cell protection mechanisms as a response to decreasing nutrient levels, increased density or changes in pH [40]. The typical growth dynamics followed by WT cells is shown in figure 2a.
Figure 2.

Evolution under prolonged starvation. (a) Bacterial growth usually begins with a period of quiescence (lag phase), followed by exponential growth, entrance into stationary phase and finally a death phase. During the death phase, more than 99% of the cell population dies as a result of the deteriorating environmental conditions. (b) The small fraction of surviving cells (less than 1%) is not genotypically stable. In this idealized representation, different genotypes arise in succession. Every new genotype is more adapted to stressful conditions than the previous one and usually has mutations conferring a GASP. (d) This table summarizes the properties of the WT and GASP strains. (Adapted from [20,41].) (c) The WT strain grows at a higher rate but will reach a lower density. The GASP cells, on the other hand, grow at a slower pace but reach a higher final density. (Data adapted from [20].)
Under prolonged starvation, a large fraction of cells maladapted to the accumulation of deteriorating conditions will die. A few remaining cells, however, often evolve the ability to grow despite stressful environmental conditions [41] (figure 2b). First observed by Zambrano et al. [21], these resistant populations are called GASP mutants, because they outcompete WT strains under starvation conditions and therefore have a GASP. Figure 2b illustrates the dynamic nature of a culture under prolonged starvation: while the total number of cells remains constant, new genotypes are constantly evolving and fixing into the population. These cells not only develop an increased resistance to external stress and deteriorating environmental conditions, but are also able to sustain a proliferative phenotype by catabolizing bacterial lysate [41].
Although GASP cells grow at a slower pace than WT cells (figure 2c,d), they are nevertheless able to outcompete WT cells through sustained growth. Vulić & Kolter [22] have quantified the competition dynamics of a population carrying the rpoS819 allele (a variant of the rpoS gene which confers a GASP phenotype [21]) and WT populations to extract a pay-off matrix and describe the fitness associated with interaction between each population. The outcome of the competition between WT and GASP cells was measured in [22] through a series of experiments that quantified the fitness of each strain (i.e. fc and fd in equation (2.1)) using antibiotic markers and selective plating to quantify the population composition after 2 and 5 days. The pay-off matrix of the measured GASP/WT interactions is shown in table 2. In particular, the pay-off matrix describes a PD type of interaction dynamics (T > R > P > S). Similar conclusions were reached by Hol et al. [18], who showed that the rpoS819 allele inserted in an E. coli background different from the one in [22] still displayed a GASP phenotype and PD interactions dynamics with WT cells.
Table 2.
Pay-off matrix computer by Vulić & Kolter [22] for competing species of WT and GASP cells. The pay-off matrix describes a PD type of game because the matrix elements satisfy T > R > P > S.
| WT | GASP | |
|---|---|---|
| WT | (1.0, 1.0) | (0.2, >1) |
| GASP | (>1, 0.2) | (0.5, 0.5) |
As the ESS for a PD pay-off matrix dictates that defection is the optimal strategy, a GASP mutant is at a definitive fitness advantage. Indeed, their experiments do show that GASP mutants unequivocally become the dominant species when competing against WT populations, but theoretical predictions [42–47] and recent experimental results [15–18] have shown that WT cells (cooperators) can survive in the presence of GASP mutants. The key in these experiments was the presence of spatial structure and heterogeneous environments, both of which favour the maintenance of cooperation. In §4, we will explore how the micro-habitat patch (MHP) system used in [15,16,18] has been used to study the competition dynamics between WT and GASP mutants cells in spatially structured and heterogeneous environments.
4. Experiments: game theory and spatial competition
The MHP system, shown in figure 3, was first described in [19] and later applied in [15,16,18] to study the similar GASP–WT competition dynamics in different adaptive landscapes. In particular, each strain expresses a different fluorescent molecule (green fluorescent protein or red fluorescent protein) and fluorescence levels inside each MHP are recorded at fixed intervals (every 10–15 min). Since the relationship between fluorescence intensity and cell density has been shown by Hol et al. [18] to scale linearly with the fraction of the habitat occupied by bacteria, the overall growth of each strain in the MHPs can be estimated by measuring the fluorescence intensity of each population. The absolute number of cells measured inside each at stationary phase typically ranges between 9500 and 12 000 cells [15,20].
Figure 3.

Micro-habitat patch device. (Adapted from [15].) (a) We physically recreate a metapopulation landscape using microfabrication. Each chamber is 100 × 100 × 10 µm in size (highlighted in cyan), and the 200 nm nanoslits (yellow) are deep enough to allow nutrients to freely diffuse inside the MHPs but small enough to prevent cells from migrating into the nutrient reservoirs. Cells can migrate between each micro-habitat using the 5 µm wide junction channels (red). (b) A computer-controlled microscope records the fluorescence intensity in each chamber every 15 min.
A variety of fitness landscapes (i.e. nutrient or stress levels) can be made by varying the number of nanoslits that couples each MHP to the nutrient reservoir, allowing study of interaction dynamics between cooperation and selfishness as a function of spatial heterogeneity. First, we describe the experiments reported in [16,19], in which half of the device has either full access (nutrient-rich) or no access to the nutrient reservoirs [19]. As a result, most MHPs therefore have the same nutrient access as their neighbour (except the two MHPs at the centre of the device). Even though the environment is spatially homogeneous, complex time-dependent dynamics are observed, both for a single population [19] and for WT–GASP competition experiments [16].
As a control, the growth of each cell type inside the MHP device has been quantified by only inoculating WT cells or only GASP mutant cells inside the device (figure 1d) [15,16]. Note a few distinctive features of each strain: first, the growth rate of WT cells is initially higher than that of GASP mutants. Fitting a logistic growth function to the growth curve gives a doubling time of about 1 h for WT cells and slightly less than 2 h for GASP cells. The large discrepancy may result from the fact that the GASP cells are inherently maladapted to conditions of neutral pH and rich media [48]. Second, the stationary phase density reached by the cells is slightly higher for GASP mutants than for WT cells. This could be due to the fact that GASP cells have the ability to process and digest nutrients during prolonged starvation that cannot be catabolized by WT cells [41].
Competition experiments were performed by inoculating a 1 : 1 mixture of WT and GASP mutant cells inside a device where the first half of the MHPs are nutrient-rich habitats and the remaining half consist of nutrient-poor habitats. The time evolution of the population distribution in the nutrient-rich habitats, as reported in [16] and [15], is reproduced in figure 4a. It is interesting to note that the population distribution evolves very little over time: the fraction of WT cells hovers around 50% for most of the experiment (figure 4b). The density of WT cells is initially higher than that of GASP mutant cells, as shown for time T < 20H in figure 4a, but the GASP mutants' sustained growth allows them to supersede WT cells as the dominant species.
Figure 4.

Growth dynamics under competition. (Adapted from [20].) (a) Growth of competing WT and GASP mutant populations (green, WT; red, GASP) in the nutrient-rich regions. (b) The time evolution of the population fraction in the nutrient-rich region shows that cells coexist at an approximately equal fraction inside the device.
On a larger scale, as shown in [16] and in figure 5a, very little growth is occurring in the region with no nutrient access and growth mainly occurs in the nutrient-rich regions. Even though the fitness landscape is homogeneous throughout the device, there are large-scale heterogeneities in the spatial distribution of each strain. These heterogeneities can be characterized by measuring the spatial correlation between each population using a technique developed by Kimura & Weiss [49], which was initially developed to describe the spatial correlation of genetic information between populations in interconnected habitats. Kimura & Weiss showed that the correlation c between a strain's population fractions p in habitats a distance j apart scales as 
 with a constant λ given by
  . Here, m is the migration rate between neighbours, and m∞ is the ‘long-range’ exchange rate—which can be thought of as the rate at which two random habitats exchange genetic information—and is formally equivalent to mutations. As no mutations are likely to occur during the experiments presented in [15,16,18], the spatial correlation has been used in [20] to described the spatial correlation of each strain within the MHP array.
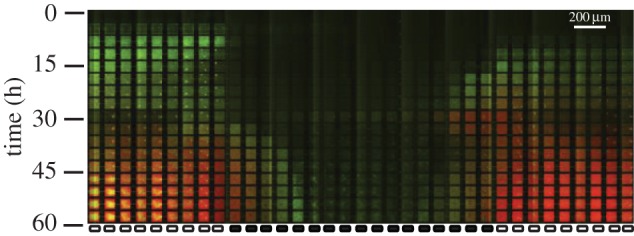
Figure 5.

Long-range spatial correlation. (a) Kymograph representation of the dynamics of the WT (green) and GASP (red) populations within the device. (b) Kimura & Weiss's average intra-species spatial correlation between neighbouring habitats as a function of distance is extracted from the fluorescence levels in each MHP. We find that the correlation length for the WT population (green circles) is longer than that of the GASP population (red squares).
For the experiment shown in figure 5a, the spatial correlation of the GASP mutant population decreases faster than that of the WT (λGASP = 1.25 μm, λWT = 1.75 μm, figure 5b). A smaller λ for GASP mutants may be explained by the fact that they grow at a slower pace than WT cells: the initially larger population of WT cells is able to exchange more cells between MHPs than GASP mutants. Consequently, important inter-species ‘mixing’ occurs among MHPs before cell exchange is severely limited by large densities of cells inside each MHP. So, as the cell density increases, the population distribution is quenched and the final distribution is mainly determined by the early (low-density) dynamics.
At a smaller scale, spatial segregation inside each MHP (figure 6a,b) [15,16,18] is also visible. The scale at which each strain spatially segregates was quantified in [16], and the GASP population was found to be spatially extended at a larger scale than the WT population. In fact, coexistence and competition is beneficial to both populations, as the density of WT cells increased under competition conditions, reaching a final density almost 20% greater when co-cultured with GASP cells (figure 4), compared with the control experiment presented in figure 4d (see [15,16] for more details about this phenomenon).
Figure 6.

Spatial coexistence. (a,b) WT and GASP cells are able to coexist spatially in each MHP at different scales. (Adapted from [16,18].) (c) WT and GASP cells were shown to interact according to a PD type of game [22], which would inevitably lead to the extinction of the WT population under well-stirred conditions. The observation that cooperator and defector populations can coexist in a spatial PD game suggests that the phase diagram describing spatial competition must be modified to account for the observed spatial coexistence.
Thus, cooperator cells coexist with selfish cells in a spatial environment, and this spatial coexistence also increases the fitness of both populations. From our naive intuition about two-player games—only the hawk–dove game allows populations to coexist, even though the measured pay-off indicates a PD type of game (figure 6c). From this experimental paradox and others like it [18,42–44], we can conclude that spatial games fundamentally change the nature of the interactions between cooperator and selfish populations to permit the maintenance of cooperation in a spatial PD game, as previously demonstrated from theoretical [42–44] and experimental [18] standpoints.
5. Spatial heterogeneities and the fate of cooperation
While competition dynamics inside spatially structured habitats has been shown to increase coexistence between cooperative and selfish populations [16,18], competition between GASP and WT populations in a spatially heterogeneous environment seems to favour the GASP population [15]. Indeed, WT cells are expected to avoid MHPs with low nutrient access and prefer ‘well-fed’ MHPs, but they instead seem to be reaching higher densities in MHPs with low nutrient access (figures 7–10) [15,20].
Figure 7.

Heterogeneous fitness landscape—WT control. Correlation coefficient between nutrient access (number of nanoslits) and the cell density. Any value higher than 0.5 indicates ‘strong’ correlations. Inset: number of nanoslits open versus position.
Figure 8.

Heterogeneous fitness landscape. The final density of WT and GASP mutant cells strongly depends on the coupling between the nutrient reservoirs and the MHP array. Here, WT cells perform better in regions where the coupling is weak (less than two nanoslits), whereas GASP mutants perform better in regions where the coupling is strong (more than five nanoslits).
Figure 9.

Growth and population distribution. (Adapted from [15].) (a) An example of two neighbouring patches where an anomalous distribution of GASP and WT cells is observed. (b,c) The fraction and overall growth of WT and GASP cells in the nutrient-rich regions show that the WT population leaves the nutrient-rich environments as the density of GASP mutants increases. (d,e) Comparatively, the fraction and overall growth of WT cells is higher in the nutrient-poor regions.
Figure 10.
Large-scale periodic fitness landscape. In environments where the fitness landscape varies on larger spatial scales, we observe similar dynamics: WT cells initially populate nutrient-rich regions but are dislodged by GASP cells following their entrance into stationary phase.
This outcome is not intuitively expected, because WT cells inoculated inside a MHP device where the number of nanoslits across the device varies to create a pseudo-random fitness landscape, as shown at the top of figure 7a and in [20], do indeed prefer nutrient-rich habitats. In figure 7, the Pearson's correlation coefficient, given by the covariance of two variables divided by the product of their standard deviations or, to be more precise, 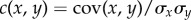 , remains positive and reaches a maximum 0.8, indicating that there is a strong correlation between growth and nutrient access. When GASP and WT cells are inoculated together inside the same landscape, a rather different outcome is observed: figure 8 shows a representative population distribution, where GASP mutant cells, shown here in red, dominate the MHPs with the highest number of nanoslits.
We will briefly summarize these results, first obtained in a device in which very high nutrient gradients are present—i.e. where there is a large change in fitness associated with moving between two habitats [15]—and in an intermediate fitness landscape (figure 10 and introduced in [20]), where changes in fitness occur over a period of 17 MHPs. Each landscape shows similar trends: WT cells, which are initially adapted to a rich medium, reach higher densities in regions where the medium has been conditioned and GASP cells, although more adapted to conditioned medium, become the dominant species in the nutrient-rich habitats. Figure 9a illustrates how very little coexistence exists between each strain within each MHP compared with the spatially homogeneous environments shown in figure 6 [16,18]. The spatial redistribution occurs 20 h after inoculation (figure 9b,c); by that time, cells have entered stationary phase and very little growth is occurring in the nutrient-rich and nutrient-poor MHPs. In figure 9d,e, the fluorescence intensity in the nutrient-rich MHPs is shown as a function of time and shows how WT cells initially populate the nutrient-rich regions, but where GASP mutant cells progressively populate the nutrient-rich MHPs and eventually become the dominant species in the nutrient-rich habitats after T = 25 h.
Furthermore, cooperation is even less favoured when the growth rate r is decreased everywhere inside the device by filling the nutrient reservoirs with conditioned medium instead of rich medium [20]. Conditioned medium is depleted of most nutrients and, as a consequence, will lower the overall growth rate of the WT population. In this situation, the WT population enters a stationary phase and redistributes itself to the nutrient-poor regions at a much earlier time. The cell density of each strain and the resulting population distribution is shown in figure 11a,b.
Figure 11.

Conditioned medium experiments. Experiments where the nutrient reservoirs contain conditioned medium (i.e. growth medium partially depleted of nutrients) are performed. (a) While GASP cells dominate in both the nutrient-rich and (b) the nutrient-poor habitats, the WT population does not go extinct and stable levels are maintained in both environments.
The first point to note is that the maximum WT density reached in the MHPs is much lower than in the rich medium experiments. The WT population reaches a maximum density in the nutrient-rich region of 5000 cells/MHP, about 45% of the density reached in figure 9d. Also, the population redistribution occurs much faster—there is no significant change in the population fraction approximately 4 h following the initial redistribution dynamics. By comparison, cells require more than 20 h to redistribute themselves into the nutrient-poor regions in figure 9a. The fact that redistribution occurs fast seems to indicate that the additional level of stress caused by the conditioned medium has greatly deceased the ability of WT cells to successfully compete against GASP mutant cells in the nutrient-rich MHPs.
The overall cell density of WT and GASP cells in the device, shown in figure 11a,b, suggests that the WT population is at a much greater fitness disadvantage under conditioned medium. Indeed, the WT cell density in the nutrient-poor regions is approximately 10 times lower than the GASP population, suggesting that coexistence fails to be maintained. These results suggest that spatial coexistence between cooperative and selfish individuals is highly dependent on the ability of cooperators to survive: a harsh environment for cooperative individuals may prevent cooperation from emerging, thereby leading to a complete dominance of the selfish population.
6. Theoretical modelling: ideal free distribution
The anomalous distribution of WT and GASP populations observed in [15] suggests that active environmental conditioning by the selfish individuals can precipitate the demise of cooperating individuals in spatially heterogeneous environments. To better understand and model these population distribution dynamics, the concept of the IFD [27–29] is particularly useful. This framework, first proposed by Fretwell and Lucas and used to describe the male–female sex ratio of bird populations in the Mississippi River Valley [26], states that individuals will populate habitats according to the amount of available resource to maximize their fitness while reducing intra-species resource competition. As an increase in population leads to a decrease in resource availability, the IFD predicts that the population will distribute itself to maximize the amount of resource available to each individual. In equilibrium, each individual has access to an optimal level of resources and any migration between patches or change to this distribution will be detrimental to the whole population: the fitness is equal in all occupied patches and species at equilibrium with respect to the IFD are stable under small spatial perturbations [31].
The per capita growth rate V is used as a definition of fitness [50] which, for a single individual subjected to logistic growth, is given by
| 6.1 |
for an individual growth rate r, a total cell number ρ and a carrying capacity K. While the fitness of an individual is directly related to the quality of the environment (growth rate r), it also depends on the number of cells populating the habitat and from the functional dependence of equation (6.1) on the cell density ρ. The fitness V may become zero or even be negative at high enough cell densities, even if the growth rate r is large.
The IFD is first applied to a single species inside the two-habitat system shown in figure 9. Křivan & Sirot [28] derive a population distribution of a two-habitat system equal to K1/K1 + K2, for carrying capacities K1 and K2 for habitat 1 and 2. In the MHP system, the carrying capacity of the nutrient-rich and nutrient-poor habitats is limited by the volume of each MHP rather than the growth rate. Cells are free to move between habitats, so if the fitness in nutrient-rich MHPs decreases due to overcrowding (second term of equation (6.1)), then they can migrate away from the nutrient-rich and move into the nutrient-poor habitats. As described in [15], the final distribution of a single population is indeed equally divided between the nutrient-rich and nutrient-poor MHPs.
While it is natural to use the IFD to describe a single species, a better description of the competition dynamics can also be achieved by including game theoretical concepts in the IFD framework [31]. In the remainder of this section, we will employ the IFD and game theory to describe the redistribution dynamics observed when WT and GASP cells compete in a heterogeneous spatial environment.
For a two-species, two-habitat system [28], the fitness of WT cells in the nutrient-rich MHPs will depend on the density of WT ρw and GASP ρg cells as
| 6.2 |
for a given growth rate rw,NR, a competition parameter αw and carrying capacity Kw (which have been measured in the single species control experiments). The parameter αw describes negative interactions between each strain, which will affect the final density of a population and is measured to be approximately 0.4 in [15].
In figure 12a, the density of WT cells in the nutrient-rich region increases until  . This occurs at T = 15 h, when the fitness VNR has just decreased to zero. Then, as the density of GASP cells in the nutrient-rich habitat continues to increase, VNR becomes negative. The fitness VNR resulting from WT and GASP interactions in the nutrient-rich MHPs becomes negative while the pay-off VNP in the nutrient-poor MHPs is positive owing to low cell density. So, WT cells can maximize their fitness by preferentially occupying the nutrient-poor regions and, as a result, the WT cells redistribute themselves from the nutrient-rich to the nutrient-poor MHPs.
Figure 12.

Measured fitness of WT cells over time. (Adapted from [15].) (a) The fitness of WT cells decreases below 0 (at T = 15 h, indicated by the arrow). This occurs as the combined density of WT and GASP cells is higher than the carrying capacity of the WT species alone. (b) The fitness of the GASP population inside the nutrient-rich regions remains positive throughout the experiment.
Similarly, the fitness WNR/rg of the GASP mutant population is shown in figure 12b. GASP cells, in contrast to WT cells, never reach a point where WNR < WNP, and GASP cells have no incentive to leave the nutrient-rich MHPs and populate the nutrient-poor MHPs.
The IFD has been used to explain the population dynamics presented in figures 9 and 10 [15,20], and a careful analysis of the fitness plots (figure 12a,b) reveals that the overall population distribution follows the general principles of the IFD quite well: cell populations distribute themselves in order to maximize fitness and decrease resource competition. Indeed, as resource includes both nutrients and available space, WT cells gain fitness by moving away from the crowded nutrient-rich regions into the sparsely populated nutrient-poor regions.
For the experiments performed under conditioned medium conditions (figure 11), equation (6.2) can be used to compute the fitness of the WT population and the result is shown in figure 13a. The presence of conditioned medium seems to affect the overall fitness of WT cells in two ways: (i) fitness decreases below zero in 10 h, compared with 15 h in rich medium, and (ii) contrarily to rich medium experiments, the fitness remains negative even after cells have migrated into the nutrient-poor MHPs. While the WT population is able to react to the GASP population's sustained growth in rich medium by migrating into the nutrient-poor habitats, figure 11b suggests that migration is not sufficient to counterbalance the fitness losses associated with proliferating GASP mutants.
Figure 13.

The IFD under conditioned medium experiments. (a) Large-scale competition dynamics show that while WT cells still survive in the presence of selfish GASP cells, their final density is severely affected by the deteriorated environmental conditions. (b) The computed fitness of the WT cells decreases and stays below 0 much more rapidly than in the nutrient-rich experiment (fitness becomes negative at T = 9 h compared with T = 15 h in fresh medium).
7. Discussion
We have shown that the growth dynamics of competing species of bacteria can be interpreted using game theory. In particular, using a species that has been previously shown to display selfishness (GASP mutants) to dominate cooperative populations (WT cells) in well-mixed experiments [22], results have shown that cooperation can and will survive if interactions are occurring locally [15,16,18]. Results in other spatial environments have also shown a similar survival of cooperation in the presence of spatial structure [17,51]. Furthermore, cooperation is shown to survive in the presence of spatial interactions by spatially segregating into less populated (and more stressful) regions, a phenomenon that can be explained when the competition dynamics are interpreted using the IFD and game theoretical concepts. However, while this survival is allowed under many experimental conditions, more stressful environments precipitate this shift and lower the overall survival potential of cooperation. It should also be noted that heterogeneity can also occur in other ways—for example in the form of stochastic or asymmetric pay-offs [47,52]—however, it is unknown experimentally whether these too allow survival of cooperation. But cooperation has been shown to result from self-organized growth [53].
We believe that game theory provides an intuitive way to describe complex interactions: it provides a means to interpret complex situations that cannot be readily explained using simplified models and, hidden within the framework of game theory, are profound concepts—such as cooperation and selfishness–that are difficult to quantify otherwise. Understanding the competitive interplay between cooperation and selfishness can influence the way complex, multi-species systems are interpreted. Indeed, as shown in figure 1, the relationship between cooperation and selfishness gives rise to four broad classes of distinct interaction dynamics and survival outcome for cooperation. Furthermore, cooperation is at a competitive advantage in spatial game theoretical models, and a better understanding of the cooperator's survival dynamics—achieved through the use of bacterial models, for instance—will generate a more complete mapping of the interplay between cooperation and selfishness to complement current theories explaining the survival of cooperation [14,54,55].
From a broader perspective, game theory can be applied to tumour cells and cancer development to characterize the way a fundamentally cooperative host competes for its own survival during cancer development. Whereas sustained growth and environment-deteriorating behaviours may be observed in tumour tissues, the shift from an observational to a proactive approach that includes game theory may provide better tools to analyse and predict the dynamics of cancer progression. While an experimental study of cancer progression within a host may be challenging, we argue that the use of bacterial models interpreted under the umbrella of game theory can provide significant insight into the evolution of antibiotic resistance [56] and cancer progression in general [57] that cannot be obtained otherwise.
Acknowledgement
We wish to thank Vlastimil Křivan and the anonymous reviewers for their helpful comments, and David Liao for enlightening discussions.
Funding statement
This work was supported by NSF grant no. NSF0750323 and National Cancer Institute grant no. U54CA143803. G.L. is supported by the Chicago Fellows Program. This work was performed in part at the Cornell NanoScale Facility, a member of the National Nanotechnology Infrastructure Network, which is supported by the National Science Foundation (grant no. ECS-0335765).
References
- 1.von Neumann J, Morgenstern O. 1944. Theory of games and economic behaviour. Princeton, NJ: Princeton University Press. [Google Scholar]
- 2.Fehr E, Schmidt KM. 1999. A theory of fairness, competition, and cooperation. Q. J. Econ. 114, 817–868. ( 10.1162/003355399556151) [DOI] [Google Scholar]
- 3.Fehr E, Gächter S. 2002. Altruistic punishment in humans. Nature 415, 137–140. ( 10.1038/415137a) [DOI] [PubMed] [Google Scholar]
- 4.Smith JM. 1974. The theory of games and the evolution of animal conflicts. J. Theor. Biol. 47, 209–221. ( 10.1016/0022-5193(74)90110-6) [DOI] [PubMed] [Google Scholar]
- 5.Axelrod R, Hamilton WD. 1981. The evolution of cooperation. Science 211, 1390–1396. ( 10.1126/science.7466396) [DOI] [PubMed] [Google Scholar]
- 6.Hamilton WD. 1964. The genetical evolution of social behaviour. I. J. Theor. Biol. 7, 1–16. ( 10.1016/0022-5193(64)90038-4) [DOI] [PubMed] [Google Scholar]
- 7.Alexander RD. 1974. The evolution of social behavior. Annu. Rev. Ecol. Syst. 5, 325–383. ( 10.1146/annurev.es.05.110174.001545) [DOI] [Google Scholar]
- 8.Tomlinson IPM. 1997. Game-theory models of interactions between tumour cells. Eur. J. Cancer 33, 1495–1500. ( 10.1016/S0959-8049(97)00170-6) [DOI] [PubMed] [Google Scholar]
- 9.Axelrod R, Axelrod DE, Pienta KJ. 2006. Evolution of cooperation among tumor cells. Proc. Natl Acad. Sci. USA 103, 13 474–13 479. ( 10.1073/pnas.0606053103) [DOI] [PMC free article] [PubMed] [Google Scholar]
- 10.Bellomo N, Delitala M. 2008. From the mathematical kinetic, and stochastic game theory to modelling mutations, onset, progression and immune competition of cancer cells. Phys. Life Rev. 5, 183–206. ( 10.1016/j.plrev.2008.07.001) [DOI] [Google Scholar]
- 11.Hamilton WD. 1964. The genetical evolution of social behaviour. II. J. Theor. Biol. 7, 17–52. ( 10.1016/0022-5193(64)90039-6) [DOI] [PubMed] [Google Scholar]
- 12.Smith JM. 1964. Group selection and kin selection. Nature 201, 1145–1147 ( 10.1038/2011145a0) [DOI] [Google Scholar]
- 13.Eberhard MJW. 1975. The evolution of social behavior by kin selection. Q. Rev. Biol. 50, 1 ( 10.1086/408298) [DOI] [Google Scholar]
- 14.Nowak MA. 2006. Five rules for the evolution of cooperation. Science 314, 1560–1563. ( 10.1126/science.1133755) [DOI] [PMC free article] [PubMed] [Google Scholar]
- 15.Lambert G, Liao D, Vyawahare S, Austin RH. 2011. Anomalous spatial redistribution of competing bacteria under starvation conditions J. Bacteriol. 193, 1878–1883. ( 10.1128/JB.01430-10) [DOI] [PMC free article] [PubMed] [Google Scholar]
- 16.Keymer JE, Galajda P, Lambert G, Liao D, Austin RH. 2008. Computation of mutual fitness by competing bacteria. Proc. Natl Acad. Sci. USA 105, 20 269–20 273. ( 10.1073/pnas.0810792105) [DOI] [PMC free article] [PubMed] [Google Scholar]
- 17.Allen B, Gore J, Nowak MA. 2013. Spatial dilemmas of diffusible public goods. eLife 2, e01169.. ( 10.7554/eLife.01169) [DOI] [PMC free article] [PubMed] [Google Scholar]
- 18.Hol FJH, Galajda P, Nagy K, Woolthuis RG, Dekker C, Keymer JE. 2013. Spatial structure facilitates cooperation in a social dilemma: empirical evidence from a bacterial community. PLoS ONE 8, e77042 ( 10.1371/journal.pone.0077042) [DOI] [PMC free article] [PubMed] [Google Scholar]
- 19.Keymer JE, Galajda P, Muldoon C, Park S, Austin RH. 2006. Bacterial metapopulations in nanofabricated landscapes. Proc. Natl Acad. Sci. USA 103, 17 290–17 295. ( 10.1073/pnas.0607971103) [DOI] [PMC free article] [PubMed] [Google Scholar]
- 20.Lambert G. 2011. Emergent collective behavior of microorganisms. PhD thesis, Department of Physics, Princeton University, Princeton, NJ, USA. [Google Scholar]
- 21.Zambrano M, Siegele D, Almiron M, Tormo A, Kolter R. 1993. Microbial competition: Escherichia coli mutants that take over stationary phase cultures. Science 259, 1757–1760. ( 10.1126/science.7681219) [DOI] [PubMed] [Google Scholar]
- 22.Vulić M, Kolter R. 2001. Evolutionary cheating in Escherichia coli stationary phase cultures. Genetics 158, 519–526. [DOI] [PMC free article] [PubMed] [Google Scholar]
- 23.Cournot AA. 1838. Recherches sur les principes mathematiques de la theorie des richesses. Paris, France: L. Hachette. [Google Scholar]
- 24.Nash J. 1951. Cooperative games. Ann. Math. 54, 286 ( 10.2307/1969529) [DOI] [Google Scholar]
- 25.Smith JM. 1982. Evolution and the theory of games. Cambridge, UK: Cambridge University Press. [Google Scholar]
- 26.Fretwell SD. 1969. On territorial behavior and other factors influencing habitat distribution in birds. Acta Biotheor. 19, 16–36. ( 10.1007/BF01601953) [DOI] [Google Scholar]
- 27.Abramsky Z, Rosenzweig ML, Pinshow B, Brown JS, Kotler B, Mitchell WA. 1990. Habitat selection: an experimental field test with two gerbil species. Ecology 71, 2358 ( 10.2307/1938646) [DOI] [Google Scholar]
- 28.Křivan V, Sirot E. 2002. Habitat selection by two competing species in a two-habitat environment. Am. Nat. 160, 214–234. ( 10.1086/341016) [DOI] [PubMed] [Google Scholar]
- 29.Craig J. 2008. A short review of pike ecology. Hydrobiologia 601, 5–16. ( 10.1007/s10750-007-9262-3) [DOI] [Google Scholar]
- 30.Cressman R, Křivan V. 2010. The ideal free distribution as an evolutionarily stable state in density-dependent population games. Oikos 119, 1231–1242. ( 10.1111/j.1600-0706.2010.17845.x) [DOI] [Google Scholar]
- 31.Křivan V, Cressman R, Schneider C. 2008. The ideal free distribution: a review and synthesis of the game-theoretic perspective. Theor. Popul. Biol. 73, 403–425. ( 10.1016/j.tpb.2007.12.009) [DOI] [PubMed] [Google Scholar]
- 32.Taylor PD, Jonker LB. 1978. Evolutionary stable strategies and game dynamics. Math. Biosci. 40, 145–156. ( 10.1016/0025-5564(78)90077-9) [DOI] [Google Scholar]
- 33.Schuster P, Sigmund K. 1983. Replicator dynamics. J. Theor. Biol. 100, 533–538. ( 10.1016/0022-5193(83)90445-9) [DOI] [Google Scholar]
- 34.Santos FC, Pacheco JM, Lenaerts T. 2006. Evolutionary dynamics of social dilemmas in structured heterogeneous populations. Proc. Natl Acad. Sci. USA 103, 3490–3494. ( 10.1073/pnas.0508201103) [DOI] [PMC free article] [PubMed] [Google Scholar]
- 35.Roszak DB, Colwell RR. 1987. Survival strategies of bacteria in the natural environment. Microbiol. Rev. 51, 365–379. [DOI] [PMC free article] [PubMed] [Google Scholar]
- 36.Houghton R. 2003. Treatise on geochemistry, pp. 473–513. Oxford, UK: Pergamon. [Google Scholar]
- 37.Morita RY. 1988. Bioavailability of energy and its relationship to growth and starvation survival in nature. Can. J. Microbiol. 34, 436–441. ( 10.1139/m88-076) [DOI] [Google Scholar]
- 38.Kolter R, Siegele DA, Tormo A. 1993. The stationary phase of the bacterial life cycle. Annu. Rev. Microbiol. 47, 855–874. ( 10.1146/annurev.mi.47.100193.004231) [DOI] [PubMed] [Google Scholar]
- 39.Loewen PC, Hengge-Aronis R. 1994. The role of the sigma factor sigmas (KatF) in bacterial global regulation. Annu. Rev. Microbiol. 48, 53–80. ( 10.1146/annurev.mi.48.100194.000413) [DOI] [PubMed] [Google Scholar]
- 40.Hengge-Aronis R. 2002. Signal transduction and regulatory mechanisms involved in control of the S (RpoS) subunit of RNA polymerase. Microbiol. Mol. Biol. Rev. 66, 373–395. ( 10.1128/MMBR.66.3.373-395.2002) [DOI] [PMC free article] [PubMed] [Google Scholar]
- 41.Finkel SE. 2006. Long-term survival during stationary phase: evolution and the GASP phenotype. Nat. Rev. Microbiol. 4, 113–120. ( 10.1038/nrmicro1340) [DOI] [PubMed] [Google Scholar]
- 42.Nowak MA, May RM. 1992. Evolutionary games and spatial chaos. Nature 359, 826–829. ( 10.1038/359826a0) [DOI] [Google Scholar]
- 43.Ohtsuki H, Hauert C, Lieberman E, Nowak MA. 2006. A simple rule for the evolution of cooperation on graphs and social networks. Nature 441, 502–505. ( 10.1038/nature04605) [DOI] [PMC free article] [PubMed] [Google Scholar]
- 44.Szabó G, Fáth G. 2007. Evolutionary games on graphs. Phys. Rep. 446, 97–216. ( 10.1016/j.physrep.2007.04.004) [DOI] [Google Scholar]
- 45.Perc M, Gómez-Gardeñes J, Szolnoki A, Floría LM, Moreno Y. 2013. Evolutionary dynamics of group interactions on structured populations: a review. J. R. Soc. Interface 10, 20120997 ( 10.1098/rsif.2012.0997) [DOI] [PMC free article] [PubMed] [Google Scholar]
- 46.Perc M, Szolnoki A. 2010. Coevolutionary games: a mini review. BioSystems 99, 109–125. ( 10.1016/j.biosystems.2009.10.003) [DOI] [PubMed] [Google Scholar]
- 47.Perc M. 2006. Coherence resonance in a spatial prisoner's dilemma game. New J. Phys. 8, 22 ( 10.1088/1367-2630/8/2/022) [DOI] [Google Scholar]
- 48.Farrell MJ, Finkel SE. 2003. The growth advantage in stationary-phase phenotype conferred by rpoS mutations is dependent on the pH and nutrient environment. J. Bacteriol. 185, 7044–7052. ( 10.1128/JB.185.24.7044-7052.2003) [DOI] [PMC free article] [PubMed] [Google Scholar]
- 49.Kimura M, Weiss GH. 1964. The stepping stone model of population structure and the decrease of genetic correlation with distance. Genetics 49, 561–576. [DOI] [PMC free article] [PubMed] [Google Scholar]
- 50.Cressman R, Křivan V, Garay J. 2004. Ideal free distributions, evolutionary games, and population dynamics in multiple-species environments. Am. Nat. 164, 473–489. ( 10.1086/423827) [DOI] [PubMed] [Google Scholar]
- 51.Wakano JY, Nowak MA, Hauert C. 2009. Spatial dynamics of ecological public goods. Proc. Natl Acad. Sci. USA 106, 7910–7914. ( 10.1073/pnas.0812644106) [DOI] [PMC free article] [PubMed] [Google Scholar]
- 52.Perc M. 2011. Does strong heterogeneity promote cooperation by group interactions? New J. Phys. 13, 123027 ( 10.1088/1367-2630/13/12/123027) [DOI] [Google Scholar]
- 53.Szolnoki A, Antonioni A, Tomassini M, Perc M. 2014. Binary birth–death dynamics and the expansion of cooperation by means of self-organized growth. Europhys. Lett. 105, 48001 ( 10.1209/0295-5075/105/48001) [DOI] [Google Scholar]
- 54.Sachs JL, Mueller UG, Wilcox TP, Bull JJ. 2004. The evolution of cooperation. Q. Rev. Biol. 79, 135–160. ( 10.1086/383541) [DOI] [PubMed] [Google Scholar]
- 55.Damore JA, Gore J. 2012. Understanding microbial cooperation. J. Theor. Biol. 299, 31–41. ( 10.1016/j.jtbi.2011.03.008) [DOI] [PMC free article] [PubMed] [Google Scholar]
- 56.Zhang Q, Lambert G, Liao D, Kim H, Robin K, Tung C-K, Pourmand N, Austin RH. 2011. Acceleration of emergence of bacterial antibiotic resistance in connected microenvironments. Science 333, 1764–1767. ( 10.1126/science.1208747) [DOI] [PubMed] [Google Scholar]
- 57.Lambert G, Estévez-Salmerón L, Oh S, Liao D, Emerson BM, Tlsty TD, Austin RH. 2011. An analogy between the evolution of drug resistance in bacterial communities and malignant tissues. Nat. Rev. Cancer 11, 375–382. ( 10.1038/nrc3039) [DOI] [PMC free article] [PubMed] [Google Scholar]