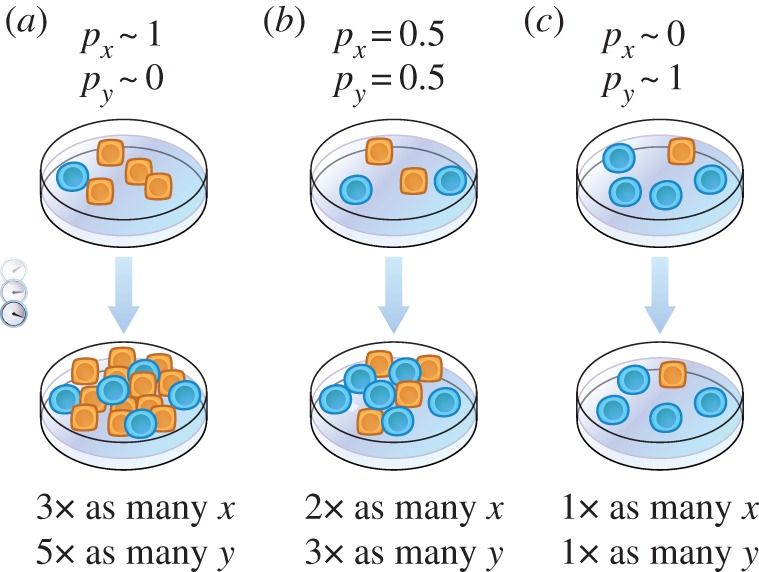
Figure 2.

Population dynamics that depend linearly on demographic composition. Three co-cultures of cells of type x (square, yellow) and cells of type y (round, blue) are prepared with different initial population compositions: (a) almost exclusively composed of cell type x, (b) 50/50 mixture of both cell types and (c) almost exclusively composed of cell type y. The factors by which each subpopulation then expands are also varied. (Online version in colour.)
