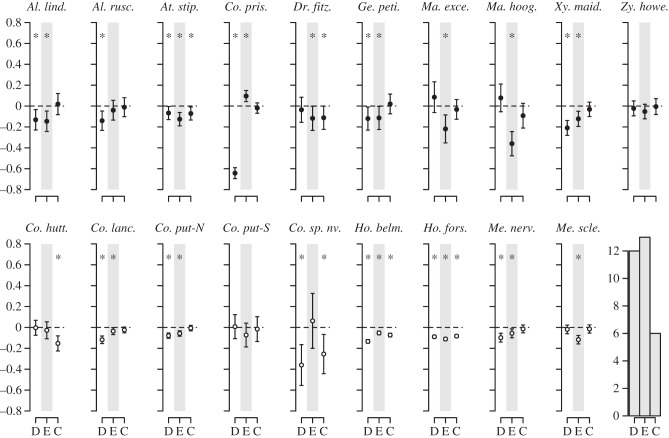
Figure 1.
Three matrix model averaging results of IBD (D), IBE (E) and IBC (C) for 19 plant species on LHI. Each plot depicts effect sizes (points) and 95% confidence intervals (error bars) for each parameter. Effect sizes below zero denote negative correlations between predictor variables and relatedness. Effect sizes above zero indicate counter-gradient effects. Estimates were determined as significant (asterisk) when the 95% CI did not span zero and by permutation tests (α = 0.045, FDR = 0.05). The bar plot indicates the number of negative effects detected for each parameter across all species. ASG, filled circles, SSG, open circles. Al. lind., Alyxia lindii; Al. rusc., Alyxia ruscifolia; At. stip., Atractocarpus stipularis; Co. prisc., Coprosma prisca; Dr. fitz., Dracopyllum fitzgeraldii; Ge. peti., Geniostoma petiolosum; Ma. exce., Macropiper excelsum subsp. psittacorum; Ma. hoog., Macropiper hooglandii; Xy. maid., Xylosma maidenii; Zy. howe., Zygogynum howeanum; Co. hutt., Coprosma huttoniana; Co. lanc, Coprosma lanceolaris; Co. put-N, Coprosma putida-N; Co. put-S, Coprosma putida-S; Co. sp. nov., Coprosma sp. nov.; Ho. belm., Howea belmoreana; Ho. fors., Howea forsteriana; Me. nerv., Metrosideros nervulosa; Me. scle., Metrosideros sclerocarpa.

