Figure 3.

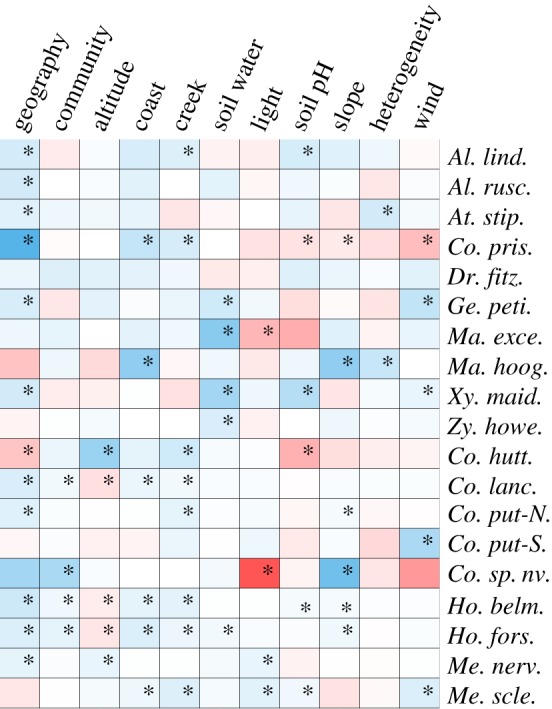
Heat map of IBD, IBC and isolation by environmental variables (IBE). Negative effects in blue, positive effects in red. Asterisk denotes significance (as in figure 1).

Heat map of IBD, IBC and isolation by environmental variables (IBE). Negative effects in blue, positive effects in red. Asterisk denotes significance (as in figure 1).