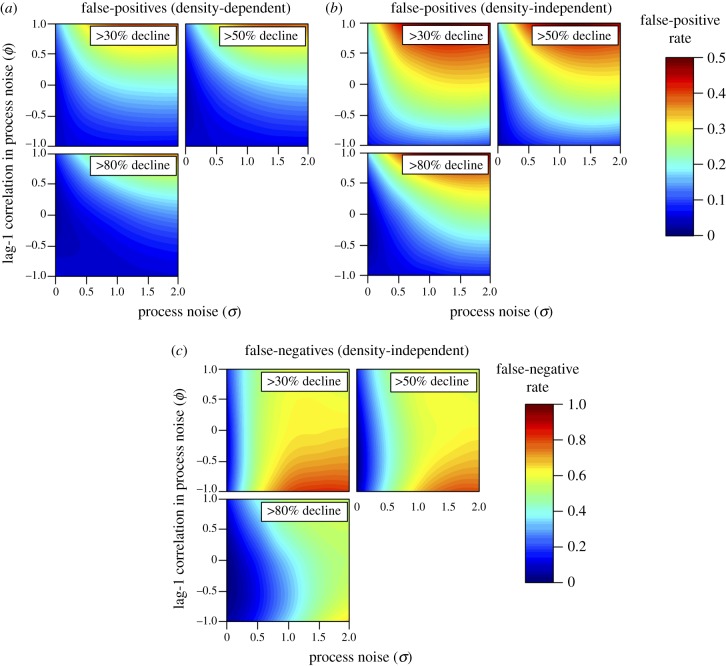
Figure 2.
Relationship among process noise (in standard deviation units), the magnitude of lag-1 correlation in process noise, and the probability (shown as coloured contours) of falsely classifying a stable population as being at increased risk of extinction (panels a,b; greater than 30%, 50% or 80% decline in abundance over 10 years, as shown in each subpanel) or failing to correctly classify a declining population as at risk of extinction (c; true decline in abundance over 10 years of 30%, 50% or 80%, as shown in each subpanel). The false-positive and -negatives rates are based on a linear regression with α = 0.1, a time series 10 time steps long, and observation error equal to 0.1 standard deviation units. False-positive rates are based on (a) simulated time series with moderate density-dependence (b = 0.65) and a population growth rate equal to 2.4 (λ; see equation (2.1)), or (b) density-independent dynamics (b = 1, λ = 0), whereas false-negative rates are based on (c) density-independent dynamics (b = 1, λ = rate of decline in subpanel).

