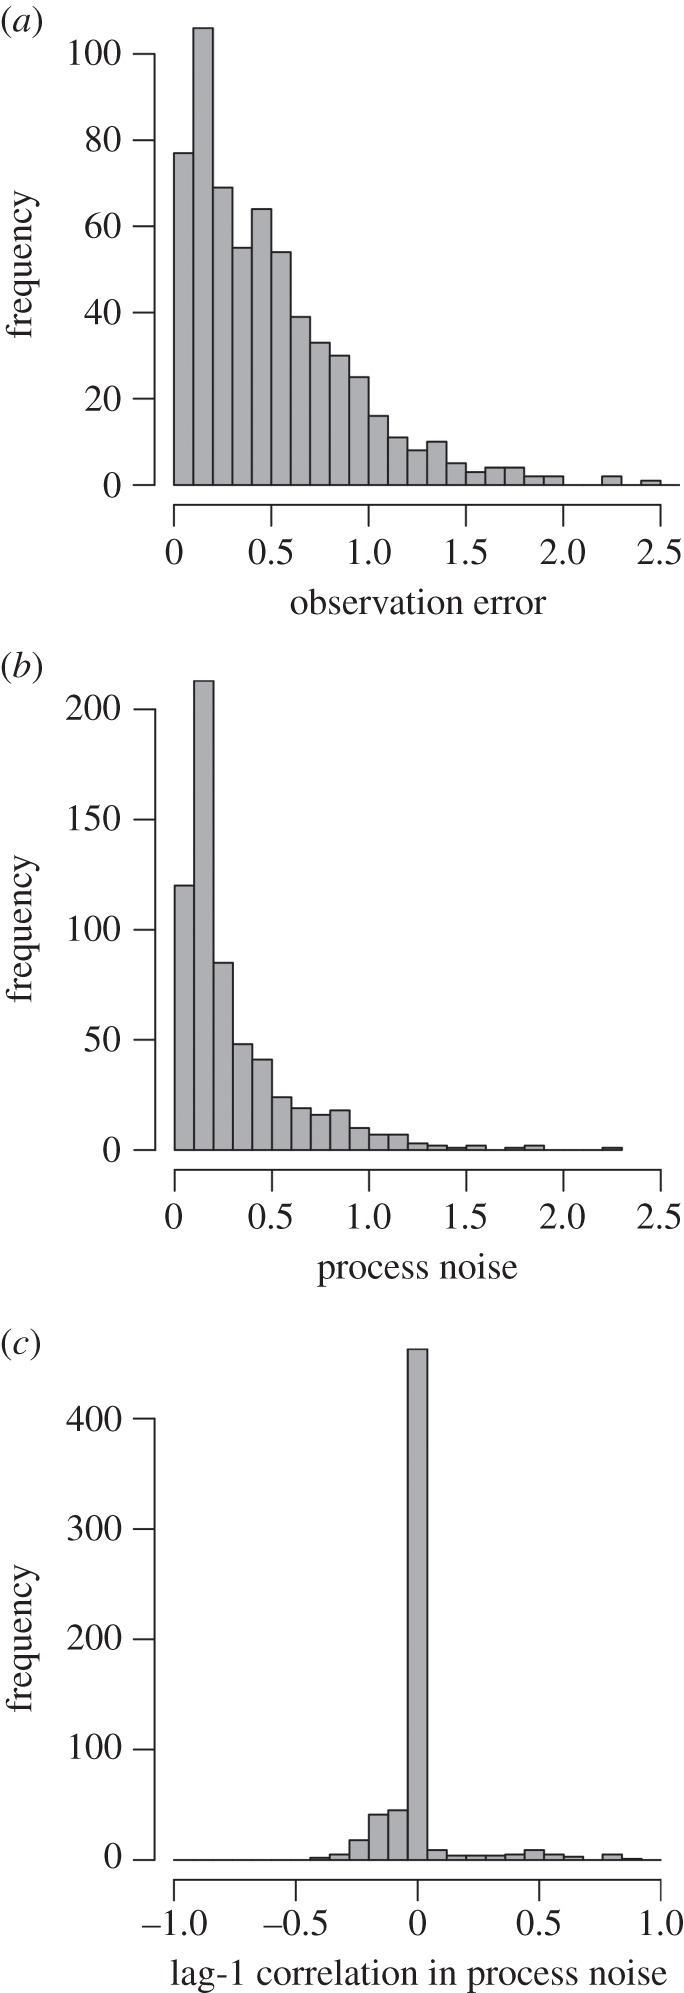
Figure 3.

Histograms of estimated median posterior probabilities for (a) process noise (in standard deviation units), (b) observation error (in standard deviation units), and (c) magnitude of lag-1 autocorrelation in process noise from 627 time series of animal abundances from the global population dynamics database. The histograms in (a) and (b) are truncated at 2.5 on the x-axes; as a result, one estimate of process noise and three estimates of observation error are not shown.
