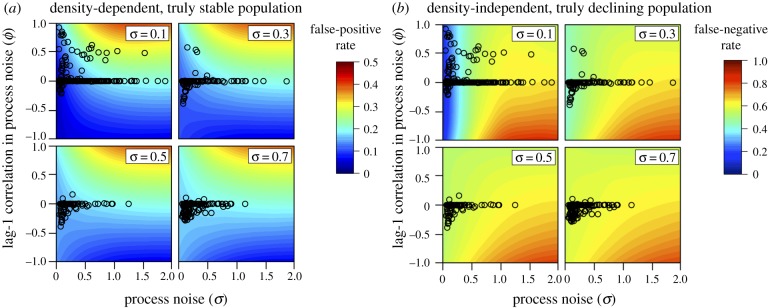
Figure 4.

Probability (coloured contours) of (a) falsely classifying a stable population as being at high risk of extinction (i.e. greater than 30% decline in abundance over 10 years) or (b) failing to correctly classify a declining population as at high risk of extinction (i.e. a 30% decline in abundance over 10 years) across a range of process noise (in standard deviation units), lag-1 autocorrelation in process noise, and observation error (in standard deviation units; sigma in the upper right corner of each plot). Empirical estimates of observation error and correlated process noise are based on time series from the global population dynamics database and are mapped onto each panel as open circles.
