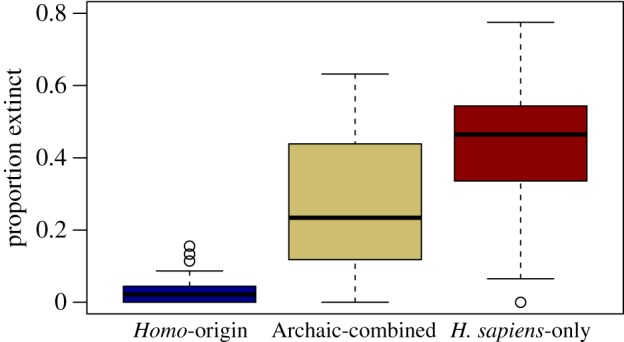
Figure 3.

Box plot of proportion of large mammals lost per TWDG country in hominin palaeobiogeographic regions. Middle line and box represent the median and first to third quartiles, respectively, and whiskers extend to the furthest data point that is no more than 1.5 times the interquartile range.
