Figure 2.
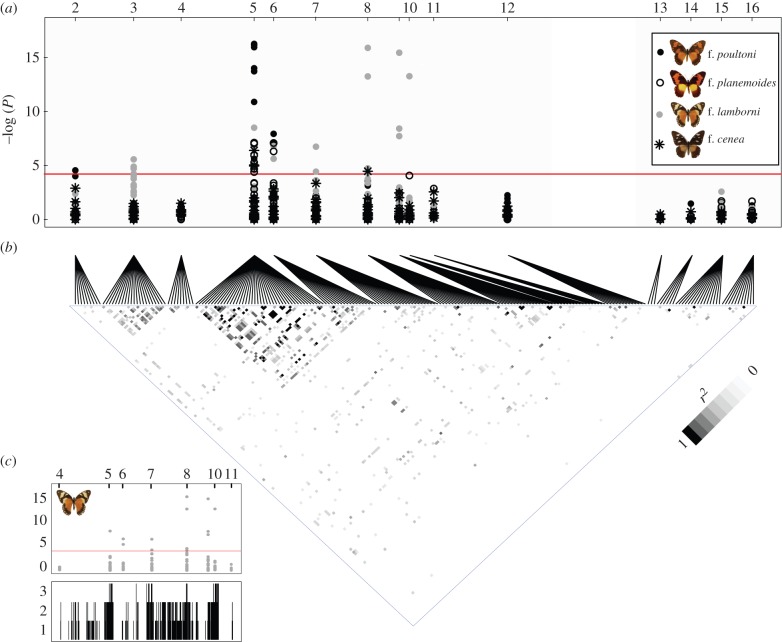
(a) Genetic associations of SNPs with wing pattern morphs. The significance of association for each SNP with a given colour morph was assessed separately for each morph against all morphs with a lower position in the dominance hierarchy. The horizontal axis represents 11 loci of the H region (2–12) and four unlinked genes (13–16). Locus 1 (MAD) did not contain polymorphic sites. The red horizontal line represents the significance threshold for association after Bonferroni correction for multiple testing. The grey symbols correspond to f. lamborni exhibiting the genomic duplication that is in perfect association with the phenotype. The SNP association therefore extends over the full length of the duplicated region. The extent of the duplication is evident from the presence of three alleles at certain nucleotide positions (see (c), bottom panel). Note that the full SNP association outside of the en locus is exclusively correlated to f. lamborni and likely correlated with the duplicated copy. (b) Heat plot showing LD (r2) of SNPs within and between loci. The 11 loci linked to the BAC tile path are given on the left, the four unlinked loci on the right. Only comparisons significant after Bonferroni correction are visualized in by grey-scale. In general, LD was low, with the exception of intra-locus comparisons within the Solute Carrier Family member and en, and inter-locus comparisons involving the two different exons of en. (c) Number of alleles observed in f. lamborni. Top panel: SNP association within the targeted region with f. lamborni as in panel (a). Bottom panel: the y-axis gives the total number of alleles observed in a 150-bp sliding window as inferred from 454 sequence data of LR-PCR products.

