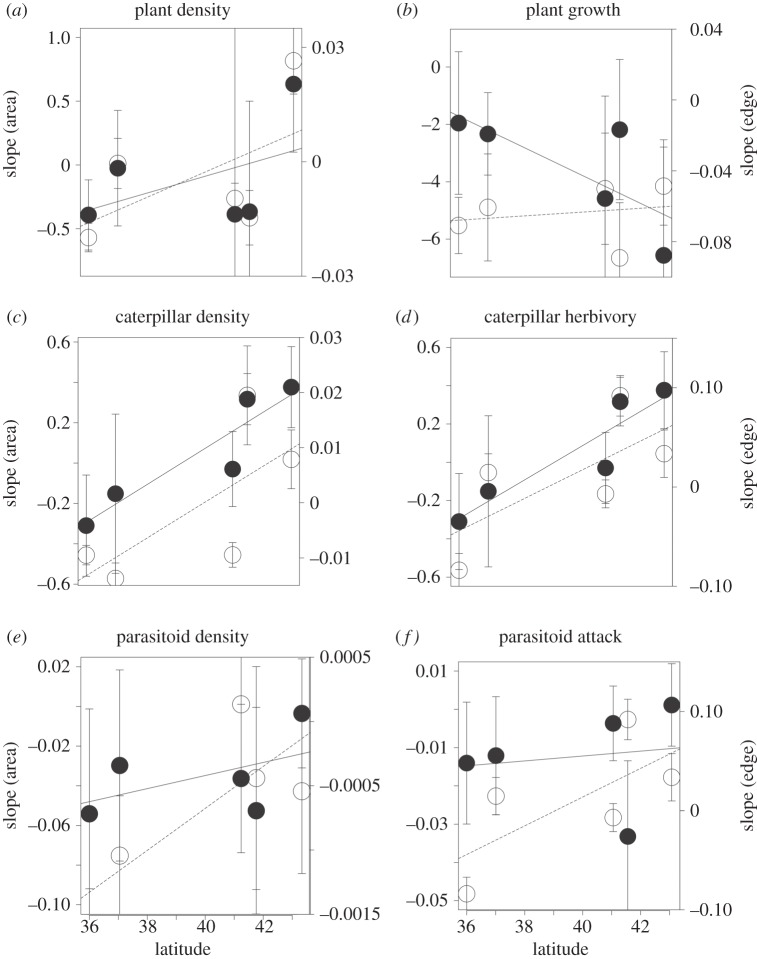
Figure 3.
Interactive effects of habitat fragmentation (fragment area and edge effect) and temperature (along a surrogate gradient of latitude) on three trophic levels (plant: (a,b); herbivore: (c,d); parasitoid: (e,f)) across two biotic measures (density: (a,c,e); and process: (b,d,f)). Values represent the slope (±95% CI) of the relationship between the biotic measure and either fragment area (solid line and filled circle) or distance from edge (dashed line, hollow circle), as calculated at each location ranging from the warmest (Auckland; 36° S) to the coolest (Banks Peninsula; 43° S). Negative slope values represent biotic measures that are highest in fragmented environments (in small fragments or near habitat edges), and positive values represent biotic measures that are highest in non-fragmented environments (in large fragments or far from habitat edges).

