
Figure 4.
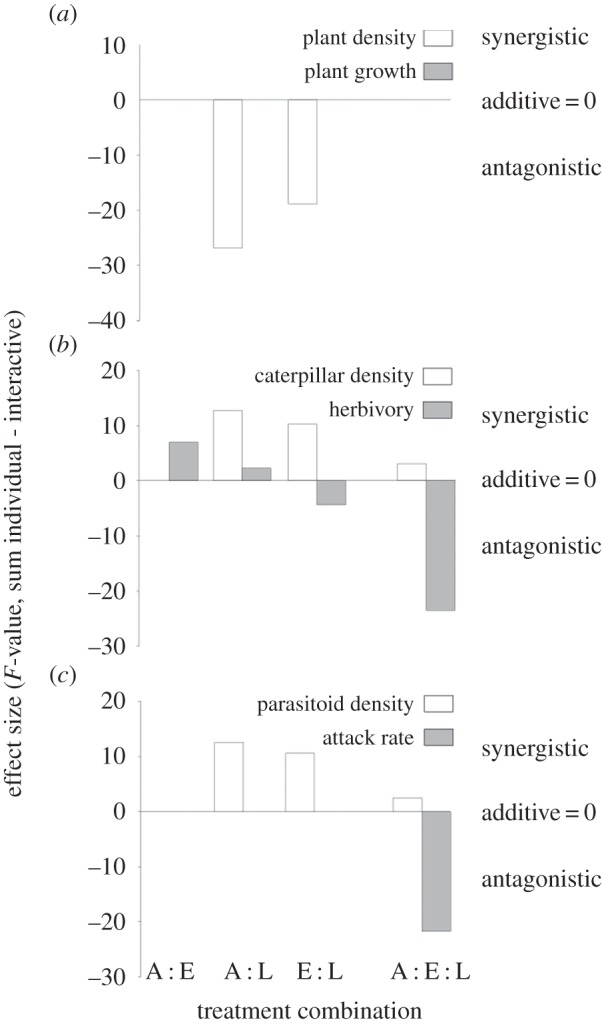
The nature and magnitude of interaction effects among fragment area (A), distance to habitat edges (E) and temperature differences as represented by a latitudinal gradient of study locations (L) on three trophic levels: (a) the host plant M. excelsum, (b) the herbivore C. scriptaria and (c) the parasitoids A. declanae and Meteorus puchricornis. Effects were classified by calculating the difference between the sum of individual effect sizes and the interactive effect sizes, with positive values representing synergistic effects and negative values representing antagonistic effects. Only treatment combinations that exhibited significant interactions (p < 0.05) in linear mixed effect models are displayed.