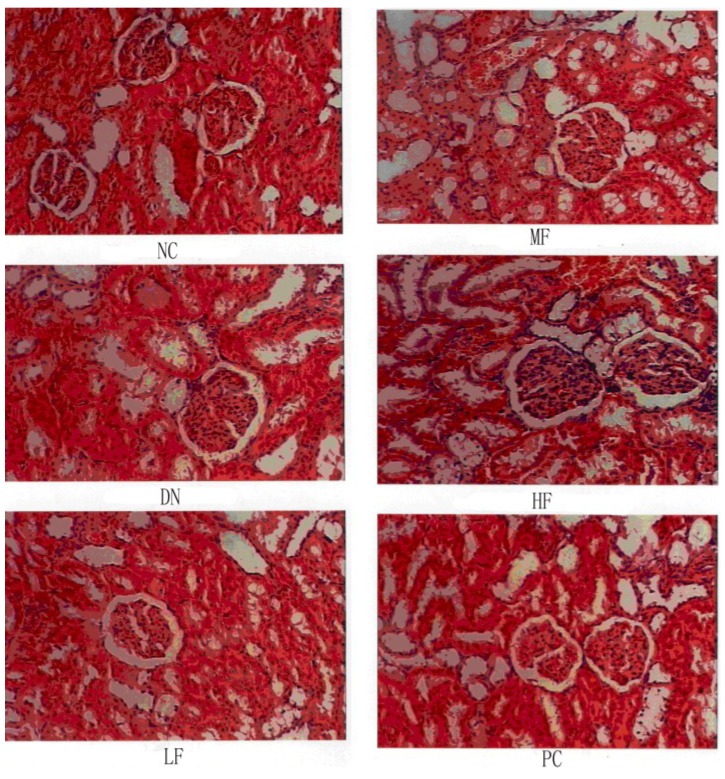
Figure 5.
Effects of FPS on the weight of STZ-induced diabetic nephropathy rat. NC: Normal control group; DN: Diabetic nephropathy group; LF: FPS, 75 mg/kg body wt; MF: FPS, 150 mg/kg body wt; HF: FPS, 300 mg/kg body wt; * p < 0.05, ** p < 0.01, compared with the DN group. Statistical analysis was performed using ANOVA. Data are presented as mean ± S.D.

