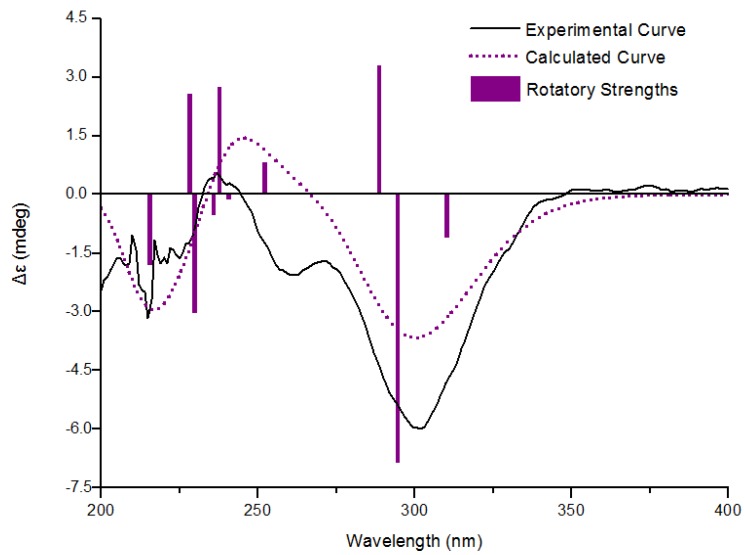
Figure 3.
Experimental and calculated electronic circular dichroism (ECD) spectra of 1 a.
a Black solid line: ECD spectrum of 1 in MeCN solution. Purple dotted line: calculated ECD spectrum for (R)-1 with CAM-B3LYP/aug-cc-pVDZ method on DFT-optimized structure. Purple bars: rotational strength values of the lowest-energy conformer of (R)-1 optimized with CAM-B3LYP/aug-cc-pVDZ.

