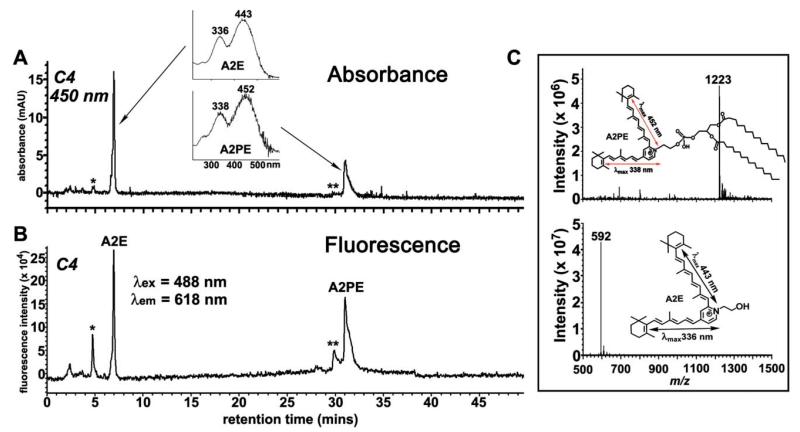
Fig. 6.
At an excitation of 488 nm the fluorescence emission of A2PE is greater than A2E. The analyte was a 1: 1 mixture of A2E and A2PE, each at 30 μM in PBS with 0.6% DMSO. Reverse phase HPLC (C4 column) with detection of absorbance (A) by photodiode array (450 nm) and fluorescence (B) with multi λ fluorescence detector (excitation, 488 nm; emission, 618 nm; bandwidth, 18 nm). Insets in A: UV-visible absorbance spectra of A2E and A2PE. *, oxidized A2E; **, oxidized A2PE. (C) Mass spectrometric analysis and planar structures (insets) of the two chromatographic peaks in A and B, corresponding to A2PE (top) and A2E (bottom). (↔), electronic transition assignments.

