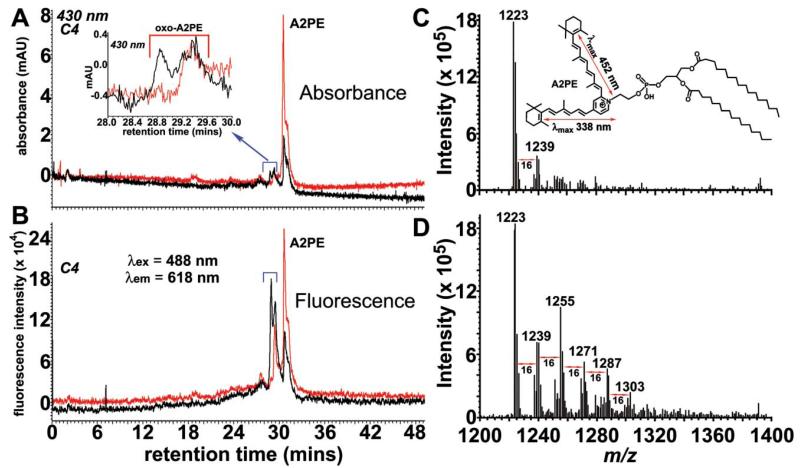
Fig. 7.
Photooxidation of A2PE. A2PE (200 μM) in PBS with 2% DMSO was irradiated for 30 min at 430 nm. Representative reverse phase HPLC chromatograms (C4 column) with monitoring of absorbance and (A) and fluorescence (B) at indicated wavelengths. Inset in A: expanded chromatogram between retention time 28-30 min. ESI-MS spectrometry of unirradiated (C) and irradiated (D) A2PE. Inset in C: structure and electronic transition assignments (↔) of A2PE. The molecular ion peak at mass-to-charge (m/z) ratio 1223 corresponds to molecular mass of A2PE synthesized from dipalmitoyl-phosphatidylethanolamine (DP-PE). Peaks differing in m/z by 16 (e.g. 1239, 1255, 1271 etc.) are indicative of A2PE photooxidation.

