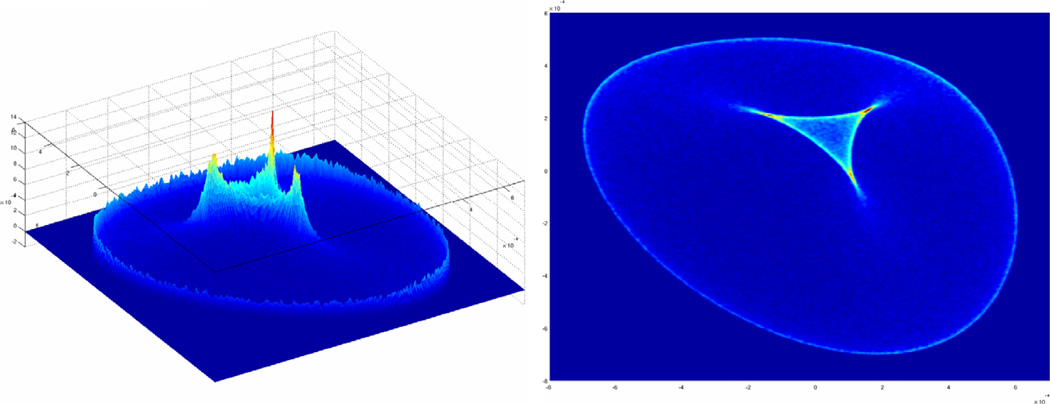
Fig. 2.
An example probability density distribution plot for RDC data measured in two alignment media as viewed from two different angles. The x and y axes correspond to RDCs measured in medium 1 and 2, respectively and the z axis is the likelihood of observing a given pair of RDC data. This plot is referred to as a λ-map.

