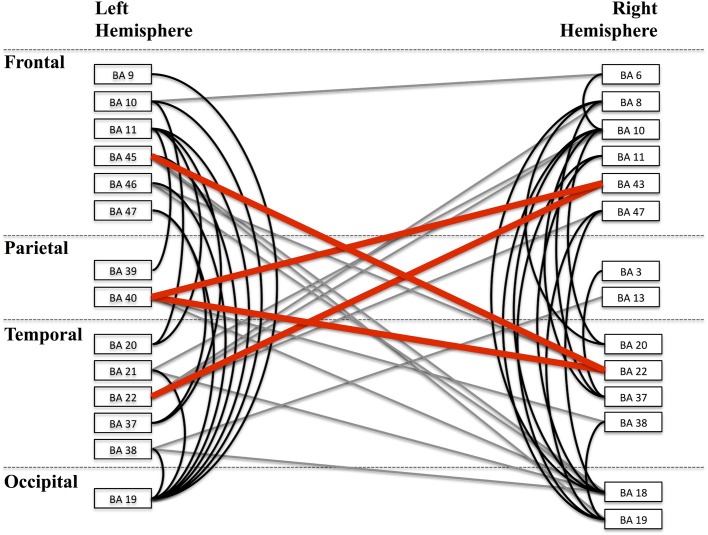
Figure 9.
Alpha band network. A depiction of the full alpha-band network is shown with each cluster labeled according to the nearest Brodmann area (BA) for visualization. Clusters are organized by lobe. Lines between regions indicate a significant connection between those two regions. Black lines are intra-hemisphere connections while gray lines are inter-hemisphere connections. Red lines depict those connections that are shown in greater detail in Figure 10.

