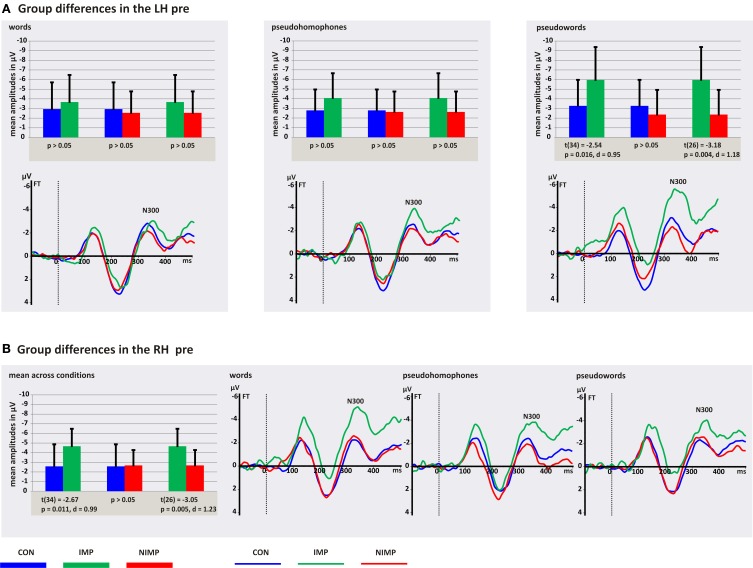
Figure 4.
N300 mean peak amplitudes for control children (CON), improvers (IMP), and non-improvers (NIMP) before intervention. (A) Illustrates group differences in the left hemisphere (LH). (B) Depicts group differences in the right hemisphere (RH). FT = fronto-temporal electrodes included in the LH and RH ROI of the N300. Negativity is depicted upwards. Error bars illustrate standard deviation.

