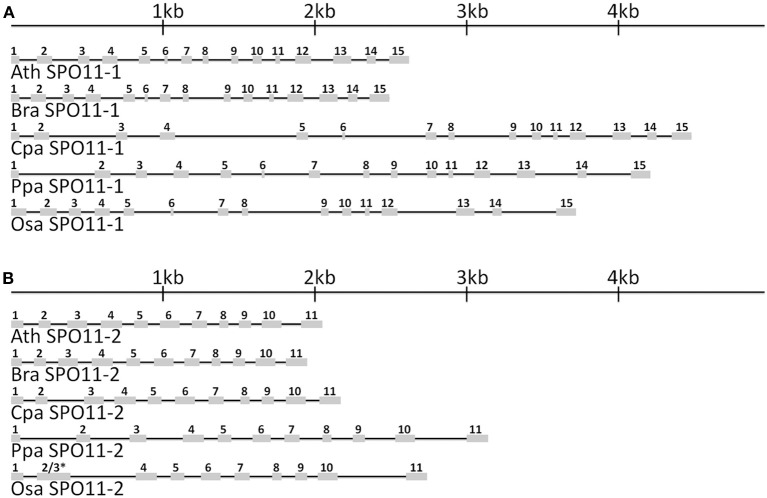
Figure 1.
The in-scale exon–intron organization of SPO11-1 (A) and SPO11-2 (B) for five analyzed species. Ath, Arabidopsis thaliana; Bra, Brassica rapa; Cpa, Carica papaya; Ppa, Physcomitrella patens; Osa, Oryza sativa. Coding regions are represented by gray boxes. The introns are represented by black lines. * Intron 2 has been lost in OsaSPO11-2. For a better comparison exon 2 was marked with 2 and 3 due to their fusion.

