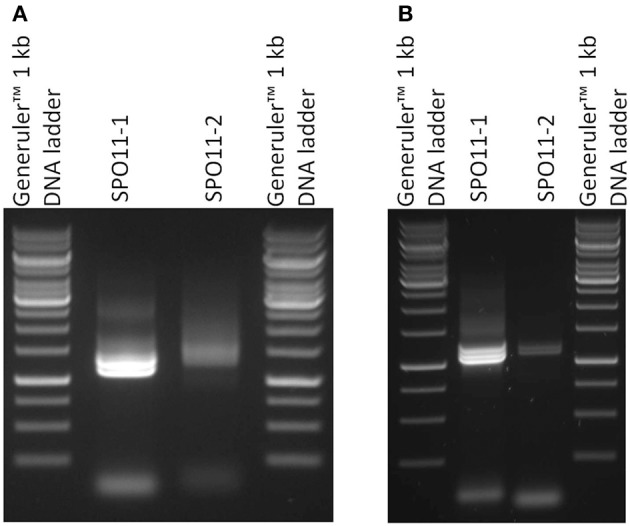
Figure 2.

Semiquantitative RT-PCR of SPO11-1 and -2 from Arabidopsis thaliana (A) and Brassica rapa (B). 1 μl of each cDNA was used for the PCR reaction. In the case of SPO11-1, distinct bands are visible. The lower band represents the α form of SPO11-1, the others are a mixture of other forms. The same holds true for SPO11-2.
