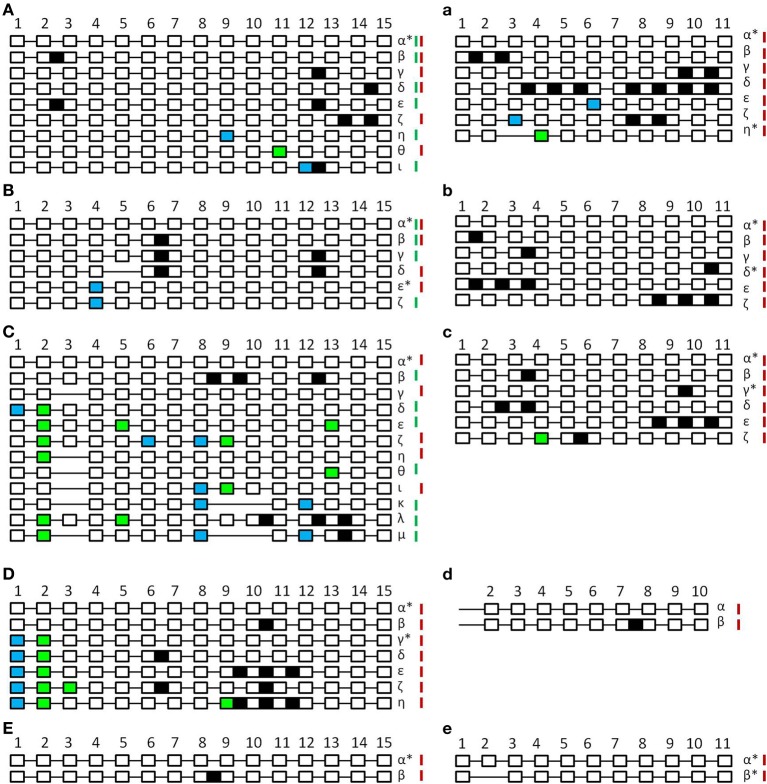
Figure 3.
Schematic unscaled schema of the different splice forms of SPO11-1 (A–E) and -2 (a–e) from Arabidopsis thaliana (A,a), Brassica rapa (B,b), Carica papaya (C,c), Oryza sativa (D,d), and Physcomitrella patens (E,e). Exons are numbered and shown as white blocks, spliced introns as black lines. Intron retention events are illustrated as black boxes, alternative 5′ splice site selection are shown as blue boxes and alterative 3′ splice site selection as light green boxes. In the case of exon skipping the corresponding white box is missing. Splicing forms are named in Greek letters. Splice forms found in generative tissue are marked with a red bar; splice forms found in vegetative tissue are marked with a green bar. Splice forms found in both tissues have both bars. Putative functional forms are marked with an asterisk. Due to high GC content and resulting PCR failure, amplification of OsaSPO11-2 was only possible from exon 2 so exon 1 is not indicated.

