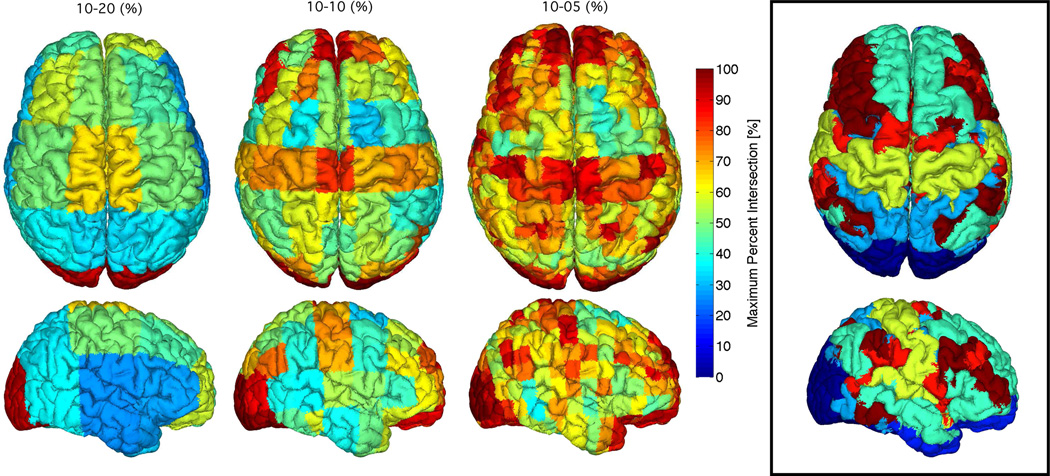
Figure 12.
Brain intersection percentages between regions of functional parcellation 1 (black box) and the electrode proximity parcellation regions for the 10–20 (left), 10-10 (middle), and 10-5 (right) positioning system. The maximum percent intersections of functional regions with electrode proximity regions are mapped to the cortical surface. Results are 20 subject averages.

