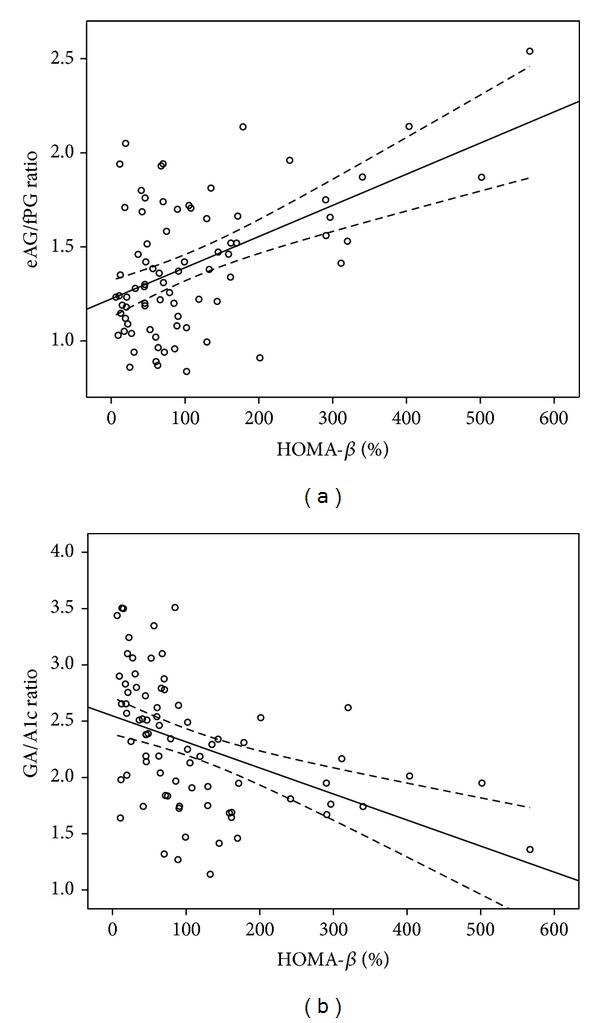
Figure 1.

Scatter plots showing the correlation between HOMA-β and the values of the eAG/fPG ratio (a) and the GA/A1c ratio (b) in T2DM. HOMA-β correlates positively with the eAG/fPG ratio (y = 0.0017x + 1.224; r 2 = 0.267; P < 0.001) but correlates inversely with the GA/A1c ratio (y = −0.0023x + 2.548; r 2 = 0.201; P < 0.001). HOMA-β, homeostasis model assessment of β-cell function; eAG/fPG ratio, the ratio of estimated average glucose to fasting plasma glucose; GA/A1c ratio, the ratio of glycated albumin to HbA1c level.
