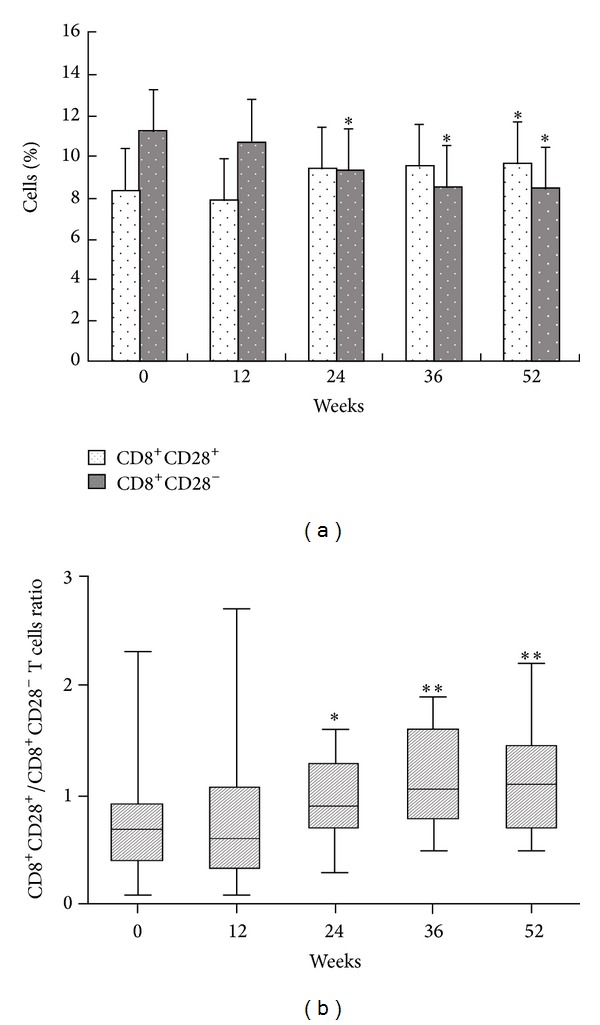
Figure 3.

Longitudinal analysis of peripheral blood CD8+CD28+ and CD8+CD28− T cells (a) and CD8+CD28+/CD8+CD28− T cells ratio (b) in 48 CHB patients over a 52-week course of Peg-IFN-α therapy. *P < 0.05, **P < 0.01, for the difference in the peripheral blood CD8+CD28+, CD8+CD28− T cell distribution and CD8+CD28+/CD8+CD28− T cells ratio between baseline and week 12, 24, 36, or 52.
