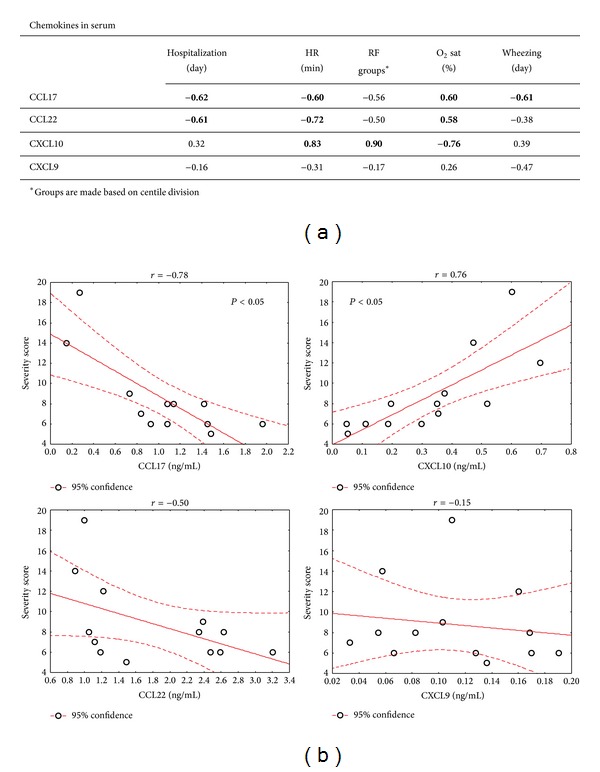
Figure 5.

Correlations of chemokine concentrations with clinical data of RSV-infected children. (a) Values in table are Spearman correlation coefficients (r). Statistically significant values (P < 0.05) are in table marked bold. (b) Graphs present correlation of chemokine with calculated severity score. Statistically significant correlations are marked with P < 0.05 sign.
