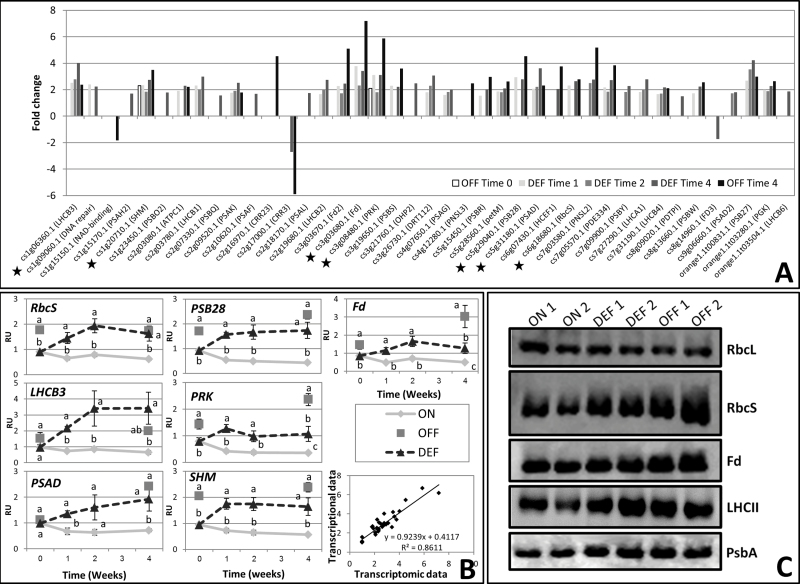
Fig. 5.
The photosynthetic machinery is up-regulated in buds of OFF-Crop (OFF) and de-fruited (DEF) trees. Fold-change (P≤0.05) in the expression of photosynthetic genes (determined by MapMan analysis, see Supplementary Fig. S2 at JXB online) in buds of OFF and DEF trees relative to buds of ON-Crop (ON) trees at the indicated time points. Asterisks mark genes selected for validation by qPCR analyses, and specific genes are listed in Supplementary File 2 (A). Expression analysis of selected genes at the indicated weeks following de-fruiting, as determined by qPCR analyses (RU, relative units). The numbers are mean values of three independent biological replicates ±SE. Different letters represent a significant difference (P≤0.05) between the states at the same time point. The lower right graph shows the linear regression between the transcriptomic and transcriptional (qPCR) data (B). Immunoblot analyses in two independent replicates of photosynthetic proteins (RbcL, Rubisco large subunit; RbcS, Rubisco small subunit; Fd, ferredoxin; LHCII, light-harvesting complex II; Psba, D1 protein) extracted from two replicates of buds of ON-Crop, (ON1 and ON2), OFF-Crop (OFF1 and OFF2), and de-fruited (DEF1 and DEF2) trees at Time 4 (C). The quantification of the protein signals, generated using ImageJ software, is presented in Supplementary Fig. S4.

