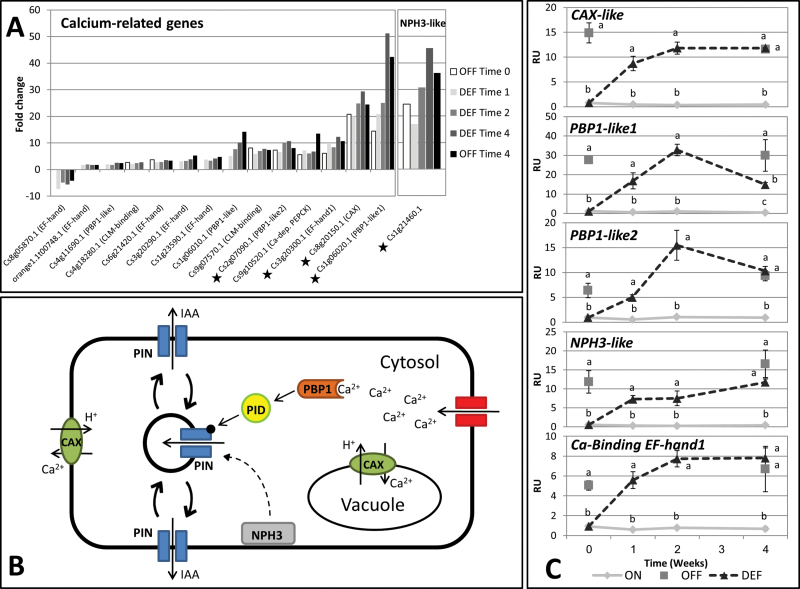
Fig. 8.
Fruit load affects the expression of Ca2+-related auxin polar transport and NPH3-like genes. Fold change (P≤0.05) in the expression of Ca2+-related and NPH3-like genes in buds of OFF-Crop (OFF) and de-fruited (DEF) trees relative to buds of ON-Crop (ON) trees (asterisks mark genes selected for validation by qPCR analyses; all genes are listed in Supplementary File 2 at JXB online) (A). Expression of the indicated genes in buds of ON, OFFm and DEF trees as validated by qPCR at the indicated time points following de-fruiting (RU, relative units). The numbers represent mean values of three independent biological replicates ±SE. Different letters represent a significant difference (P≤0.05) between the states at the same time point. (B) Linear regression between transcriptomic data and transcriptional data (qPCR analyses) is presented in Supplementary Fig. S7. Schematic model representing Ca2+ and NPH3 regulation of PIN cellular localization (C). (This figure is available in colour at JXB online.)

