Fig. 3.
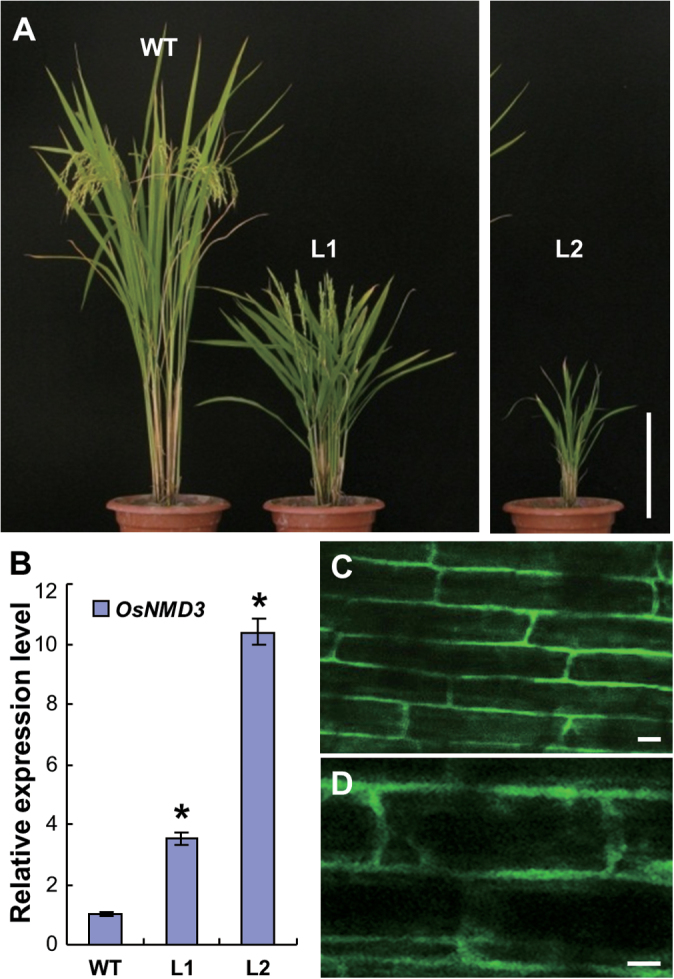
Expression of OsNMD3 ΔNLS GFP affects plant growth. (A) Three-month-old wild-type and transgenic plants expressing OsNMD3 ΔNLS GFP; L1 and L2 are two separate transgenic lines. (B) Relative expression of OsNMD3 in wild-type and two transgenic lines; data are mean±SE (n=3, *P<0.01 by Student’s t-test). (C and D) OsNMD3ΔNLSGFP signals in the root cells (C); an enlarged image is also shown (D). Bars, 25cm (A) and 10 μm (C and D).

