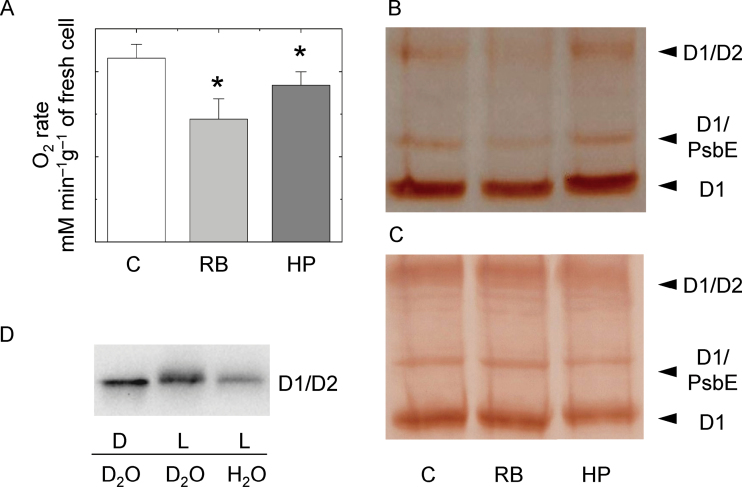
Fig. 3.
(A) Oxygen evolution rates of ACSC under control conditions (C) and after the 30min treatments with 0.5 μM RB and 500 μM H2O2, *P-value <0.05. (B and C) Western blot analysis of the D1 protein of PSII after the 30min treatment with 0.5 μM RB and 500 μM H2O2 (HP) under continuous illumination (B) and in the dark (C). Lane 1, control (C); lane 2, RB; lane 3, HP. Each lane was loaded with 70 μg of protein. The upper, middle, and lower band show the D1/D2 heterodimer of PSII, the adduct between the monomeric D1 protein and the α-subunit of the cytochrome b559 (D1/PsbE), and the monomeric D1 (D1), respectively. (D) Western blot analysis of the D2/D1 heterodimer of PSII after the 30min treatment of broken ACSC with 5 μM RB under continuous illumination at 150 μE m−2 s−1 (L) or in the dark (D) in water or deuterium oxide (D2O). Each lane was loaded with 30 μg of protein.

