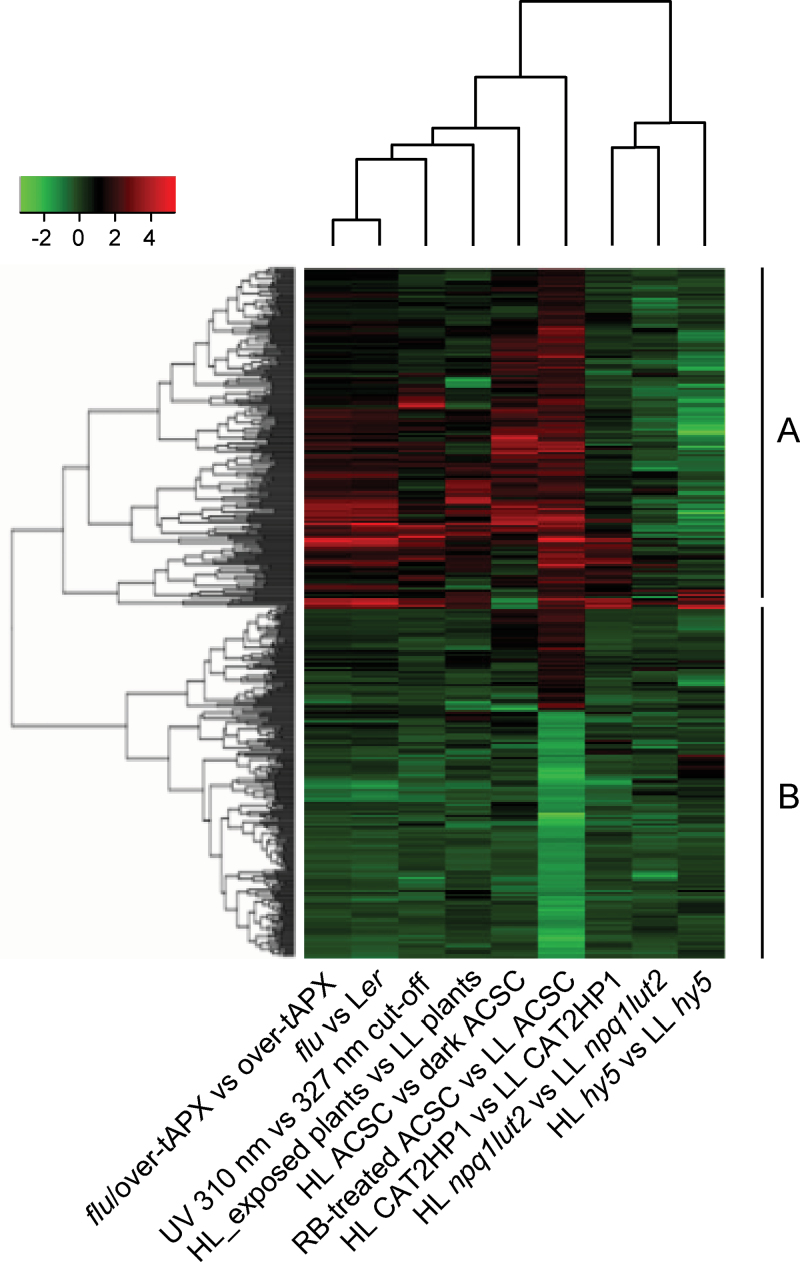
Fig. 6.
Overall picture of the hierarchical clustering analysis on the 485 transcripts with statistically differential expression and fold change |Log2|>1 in ACSC after the treatment with 0.5 μM RB. Data were clustered together with available expression microarray data from HL experiments and Arabidopsis mutants included in the GENEVESTIGATOR database: HL hy5 vs LL hy5, long hypocotyl5 transcription factor mutant of A. thaliana (Col-0) seedlings exposed to HL irradiance (1000 μE m–2 s–1) for 3h versus low light (LL) irradiance (100 μE m–2 s–1) (Kleine et al., 2009); HL npq1lut2 vs LL npq1lut2, double mutant of 6-week-old plants of A. thaliana (Col-0) lacking violaxanthin de-epoxidase and lycopene-ε-cyclase activities exposed to HL irradiance (1000 μE m–2 s–1) for 2h versus LL irradiance (25 μE m–2 s–1) (Alboresi et al., 2011); HL CAT2HP1 vs LL CAT2HP1, 6-week-old catalase-deficient plants of A. thaliana (Col-0) exposed to HL irradiance (1600–1800 μE m–2 s–1) for 8h versus LL irradiance (100–140 μE m–2 s–1) (Vanderauwera et al., 2005); RB-treated ACSC vs LL ACSC, this study; HL ACSC vs dark ACSC, Arabidopsis cell suspension cultures exposed to HL irradiance (1000 μE m–2 s–1) for 0.5h versus 1h dark conditions (González-Pérez et al., 2011); HL-exposed plants vs LL plants; mature wild-type plants of A. thaliana (Col-0) exposed to HL irradiance (1400–1600 μE m–2 s–1) for 1h versus LL irradiance (40–70 μE m–2 s–1) (Rossel et al., 2007); UV 310nm vs 327nm cut-off; seedlings of A. thaliana (Wassilewskija) exposed for 15min at midday to UV-B from Philips TL 40W/12 UV fluorescent tubes unfiltered through a 3mm quartz plate versus filtered through a 3mm transmission WG327cut-off filter (Ulm et al., 2004); flu vs Ler, the flu mutant of A. thaliana (Ler) exposed to light irradiance (90 μE m–2 s–1) for 2h after incubation in the dark for 8h versus dark conditions (Laloi et al., 2007); flu/over-tAPX vs over-tAPX, the flu mutant of A. thaliana (Ler) overexpressing the thylakoid-bound ascorbate peroxidase (tAPX) exposed to light irradiance (90 μE m–2 s–1) for 2h after incubation in the dark for 8h versus dark conditions (Laloi et al., 2007). See the text for a detailed description of the main clusters A and B.

