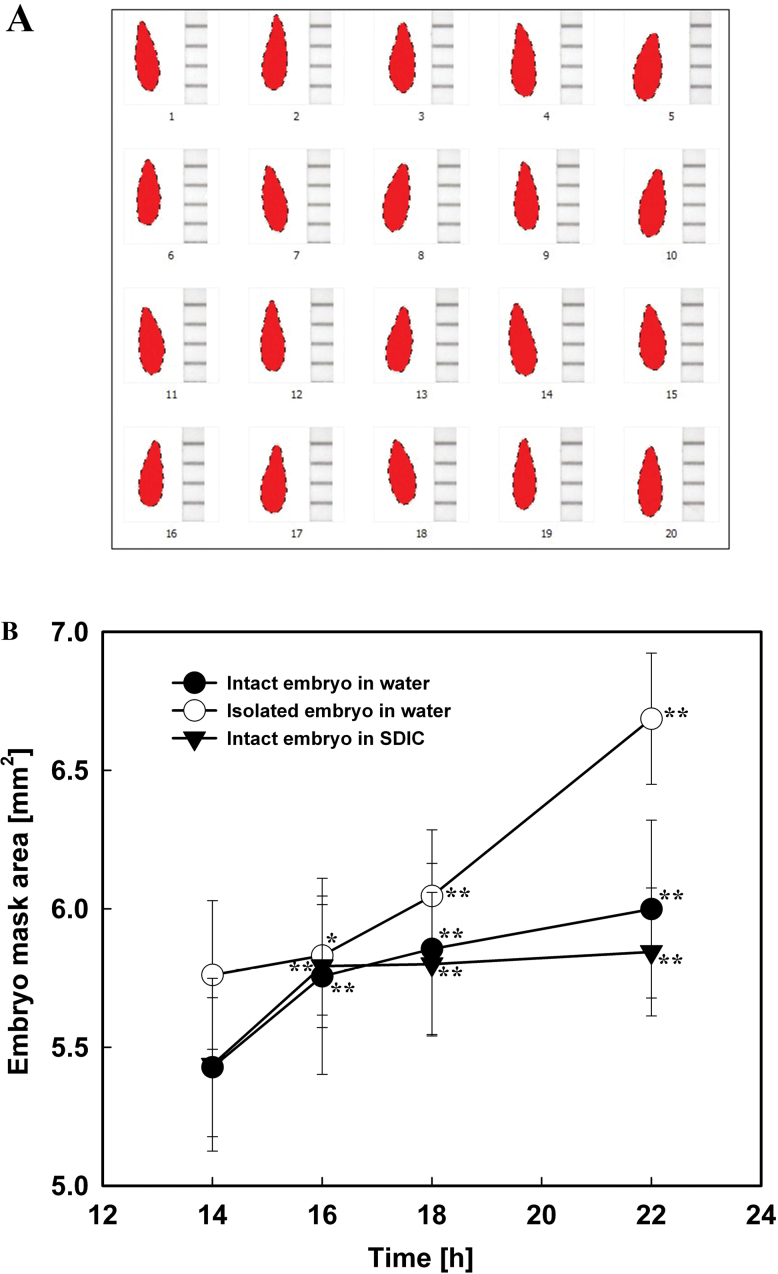
Fig. 2.
Embryo growth potential (embryo mask area) measurements. (A) Embryo masks converted from images as described in the text. (B) Changes in the mask area of intact (filled circles) and isolated (open circles) embryos of lettuce seeds imbibed in water, and intact embryos (filled triangles) imbibed in 0.3% SDIC. Data are means ±SE of three biological replicates of 20 seeds each. Significant differences in the data at 16, 18, and 22h from those at 14h of each treatment were assessed by Student’s t-test (*P<0.05, **P< 0.01). (This figure is available in colour at JXB online.)

