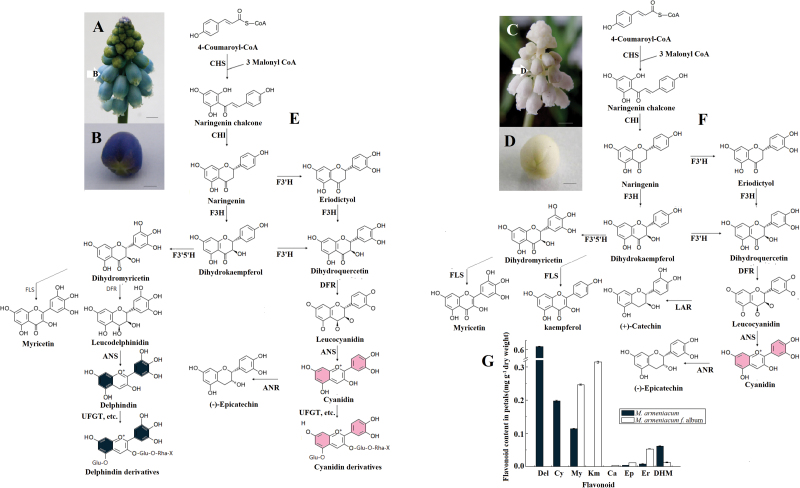
Fig. 1.
A diagram of the putative anthocyanin metabolic process in blue or white M. armeniacum flowers. (A) Mature inflorescence of M. armeniacum. Arrows represent small flower buds just before bloom. (B) Flower bud of M. armeniacum just before bloom used in deep sequencing. (C) Mature inflorescence of M. armeniacum f. album. (D) Flower bud of M. armeniacum f. album just before bloom used in deep sequencing. The scale bar=2mm in A and C, and 1mm in B and D. (E) The putative anthocyanin metabolic process in blue M. armeniacum flowers. (F) The putative anthocyanin metabolic process in white M. armeniacum flowers. (G) Flavonoid composition obtained by HPLC from blue and white flowers of M. armeniacum. ANR, anthocyanidin reductase; ANS, anthocyanidin synthase; Ca, catechin; CHI, chalcone isomerase; CHS, chalcone synthase; Cy, cyanidin; Del, delphinidin; DFR, dihydroflavonol 4-reductase; DHM, dihydromyricetin; Ep, epicatechin; Er, eriodictyol; F3H, flavanone 3-hydroxylase; F3′H, flavonoid 3′-hydroxylase; F3′5′H, flavonoid 3′5′-hydroxylase; FLS, flavonol synthase; Km, kaempferol; LAR, leucoanthocyanidin reductase; UFGT, anthocyanidin 3-O-glucosyltransferase. (This figure is available in colour at JXB online.)

