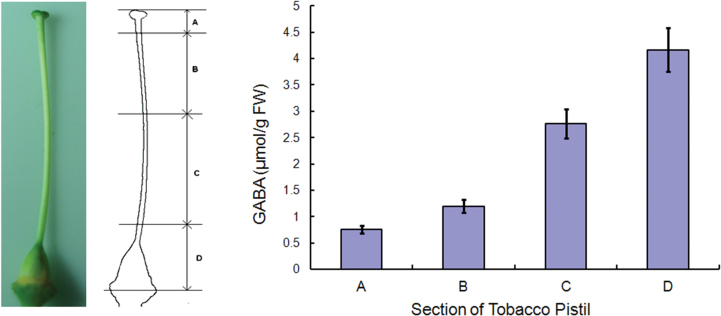
Fig. 2.
A GABA gradient is present along the length of the pistil. (A–D) Sections of tobacco pistil used for analysis. (A) Uppermost section of the pistil including the stigma; (B) upper section of the style; (C) bottom section of the style; (D) bottom section of the pistil including the ovary. The GABA concentration in each section was determined using an L-8800 automatic amino acid analyser. Means ±SE represents three independent repeats. (This figure is available in colour at JXB online.)

