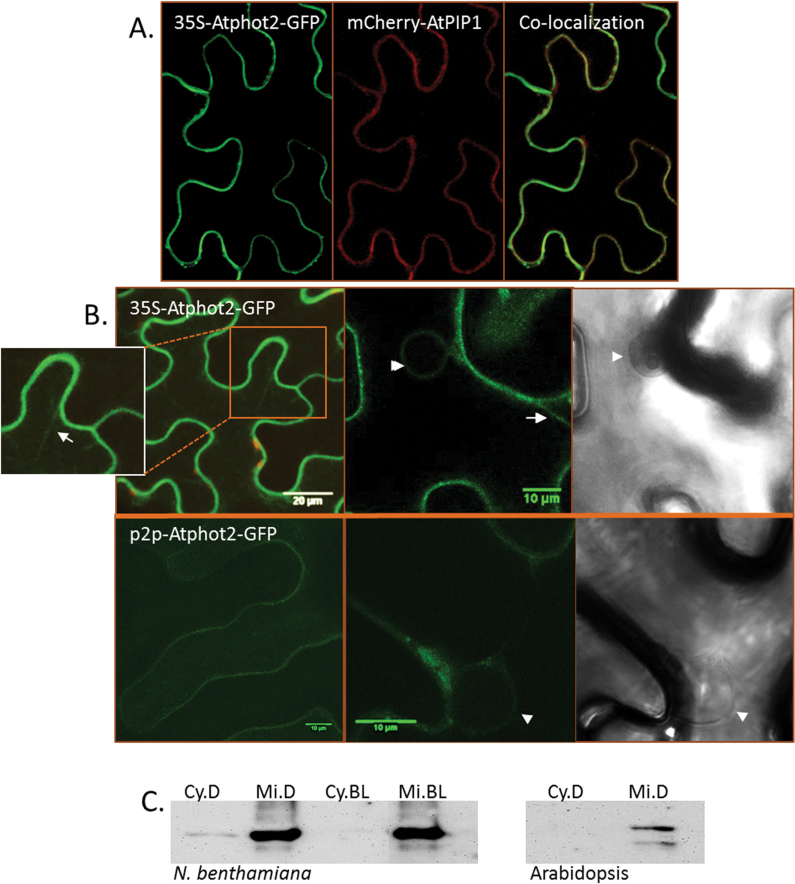
Fig. 1.
Phot2 localization. (A) Atphot2–GFP co-expressed with the plasma membrane marker PIP1 in N. benthamiana. (B) 35S-Atphot2–GFP and p2p-Atphot2–GFP showing green fluorescence at the plasma membrane, cytoplasmic strands (arrows), and nuclear envelope (arrowheads). (C) Western blot using anti-Atphot2 antibody. Cy, cytosolic; Mi, microsomal; D, dark; BL, blue light. The band corresponding to phot2 is visible in the cytosolic and microsomal fractions isolated from N. benthamiana leaves. In the Arabidopsis WT, phot2 is visible only in the microsomal fraction.

