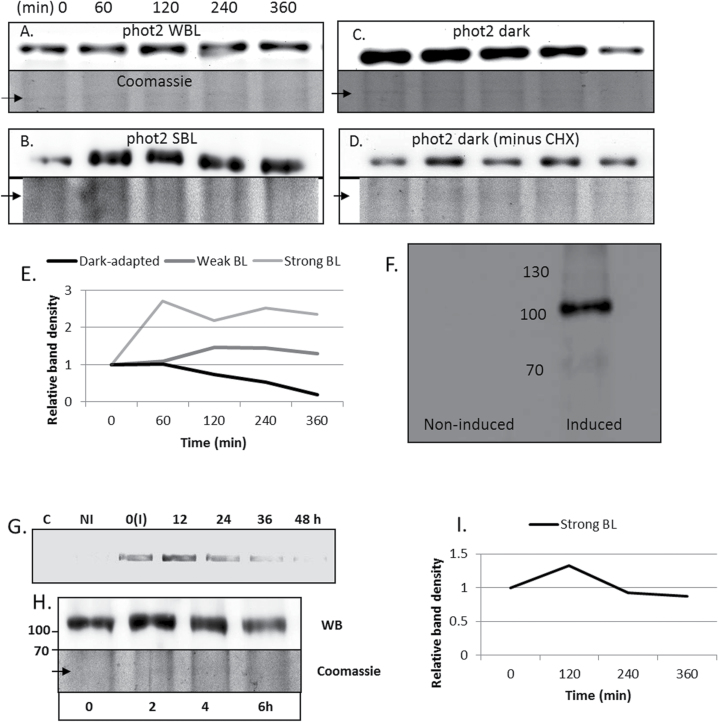
Fig. 10.
Phot2 turnover. (A–C) Phot2 detected with an anti-Atphot2 antibody in microsomal protein fractions (50 μg) isolated from leaves of the Arabidopsis phot1 line [pre-treated with cycloheximide (CHX)] (A) after weak blue light (WBL; 2 μmol m–2 s–1), (B) after strong blue light (SBL; 120 μmol m–2 s–1) irradiation, and (C) in dark-adapted plants. (D) Phot2 detected by immunoblotting in dark-adapted leaf samples not pre-treated with CHX. The upper picture represents the western blot and the lower is the Coomassie blue staining. (E) Quantitative analysis of phot2 turnover in Arabidopsis phot1 mutant leaves. (F) Western blot analysis of microsomal protein fractions (100 μg) obtained from N. benthamiana leaves transiently expressing phot2I. No phot2 signal was detected after anti-Atphot2 staining under non-inducible conditions (left column) while a phot2 signal appeared after induction with a 5 μM β-oestradiol for 12h (right column). The molecular weight (kDa) of the protein marker can be seen in the centre. (G) mRNA levels of phot2 in N. benthamiana leaves transiently expressing phot2I. 0(I) represents mRNA levels immediately after 12h induction with a 5 μM β-oestradiol solution. (H) Protein levels of PHOT2 in N. benthamiana leaves transiently expressing phot2I. At 36h after induction, the leaf samples were continuously irradiated with strong blue light and the samples were collected every 2h. The concentration of the protein used was 50 μg. (I) Quantitative analysis of phot2 turnover in N. benthamiana. C, control; NI, non-induced; I, induced. All studies were performed at least three times on independent samples.

