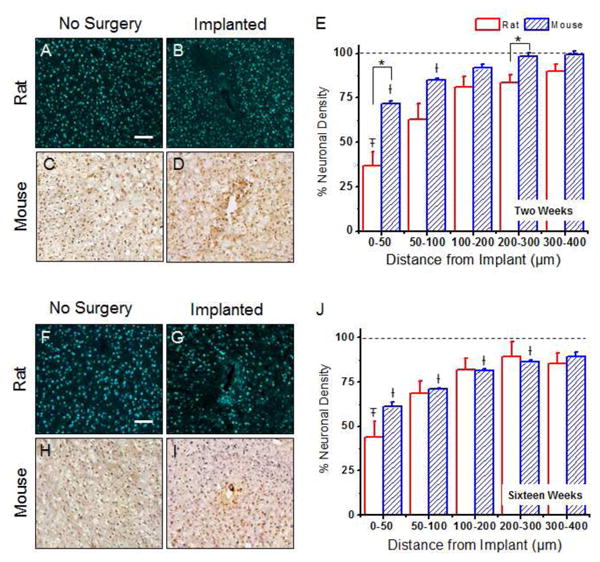
Figure 5.

Neuronal nuclei densities around implanted microelectrodes in the rat and the mouse model. At two weeks post implantation, statistical differences between neuronal densities the rat and mouse models were noted from 0-50 μm and 200-300 μm away from the implant (A-E). No significant differences were observed between the animal models at sixteen weeks post implantation (F-J). The total neuronal nuclei density was calculated for each model at two and sixteen weeks and is reported as a percent cell density to a non-surgical, age-matched sham control. Data represents an average ± s.e.m. *p<0.003; ‡p<0.01 vs. rat sham background; †p<0.002 vs. mouse sham background, scale = 100μm; n = 4-7 animals for each cohort
