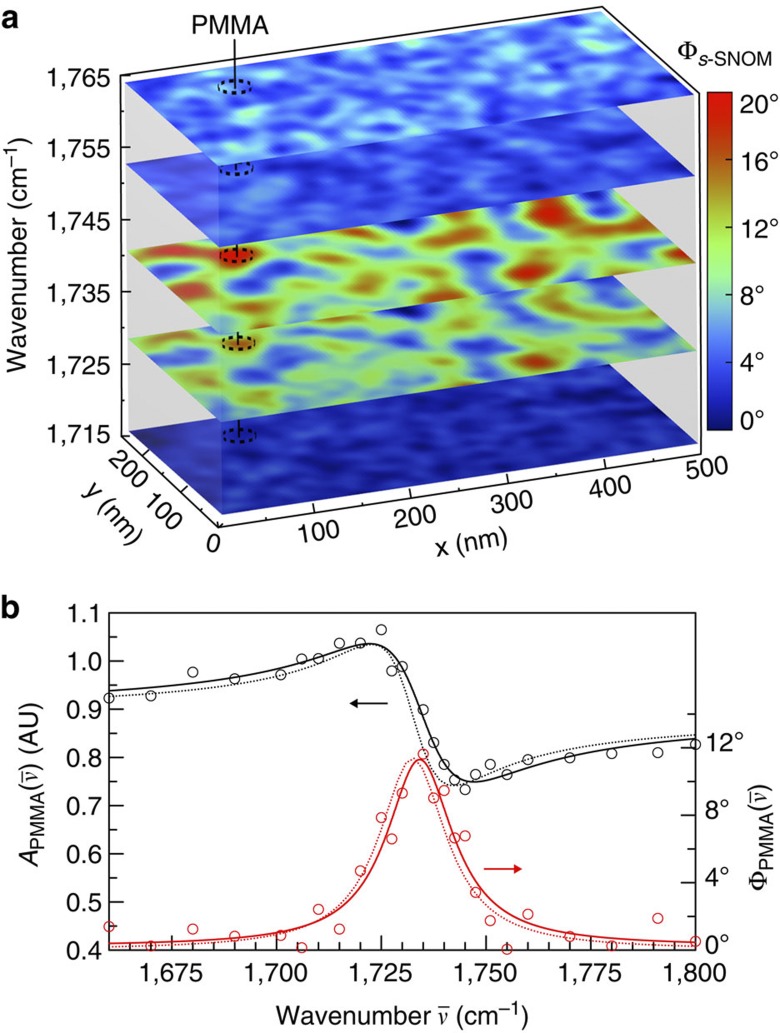
Figure 3. Spatiospectral nano-imaging.
(a) Multispectral s-SNOM phase image of PS-b-PMMA. Carbonyl resonant PMMA region highlighted for illustration. Colour bar indicates spectral phase  . (b) s-SNOM amplitude
  and phase
  spectrum of a ~25 × 25 nm2 PMMA region (referenced to a non-resonant PS region of similar size), with real and imaginary Lorentzian fits for the amplitude and phase, respectively (solid lines). Dotted lines show
  (black) and
  (red) from far-field spectroscopic ellipsometry, scaled vertically for comparison.

