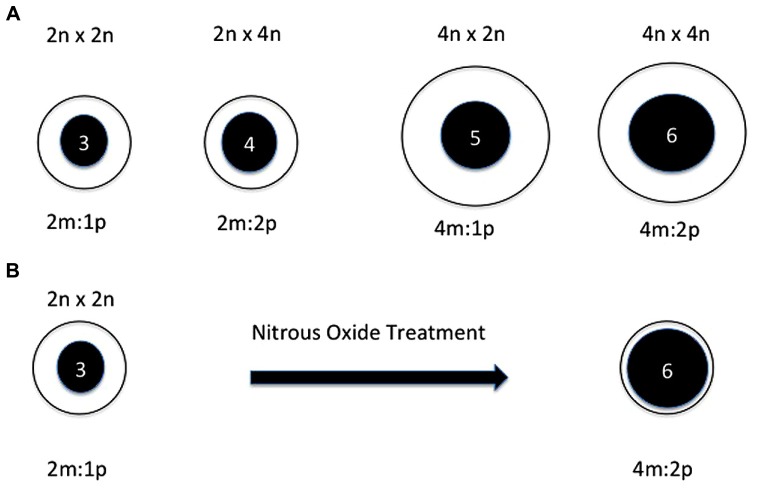
FIGURE 1.
(A) Depictions of the primary endosperm cell after fertilization of normal and interploidy crosses. From left to right: diploid, interploidy diploid by tetraploid, interploidy tetraploid by diploid, tetraploid. The crosses are noted across the top. The cell size is depicted by the clear circles and the nucleus size is depicted by the inner filled circles. The ploidy of each nucleus is noted within and the maternal to paternal genomic relationship is shown below each image. The interploidy endosperms both result in developmental failure. In the diploid and tetraploid crosses the maternal to paternal relationship is the same as is the maternal gametophytic relationship to the genomic dosage after fertilization. In both of the interploidy crosses, the maternal to paternal contributions are changed as is the maternal gametophytic relationship to the genomic dosage after fertilization. (B) Depiction of the primary endosperm cell before and after chromosome doubling via nitrous oxide treatment. At the left is depicted a primary endosperm cell from a normal diploid plant. At the right is shown a depiction when the nucleus is doubled in chromosome number from triploid to hexaploid in the progenitor smaller cell. In the latter, even though the maternal to paternal relationship is the same as a tetraploid, the maternal gametophytic contributions would be typical of a diploid but with a doubled genome with which to interact. Based on a figure from Bauer (2006).

