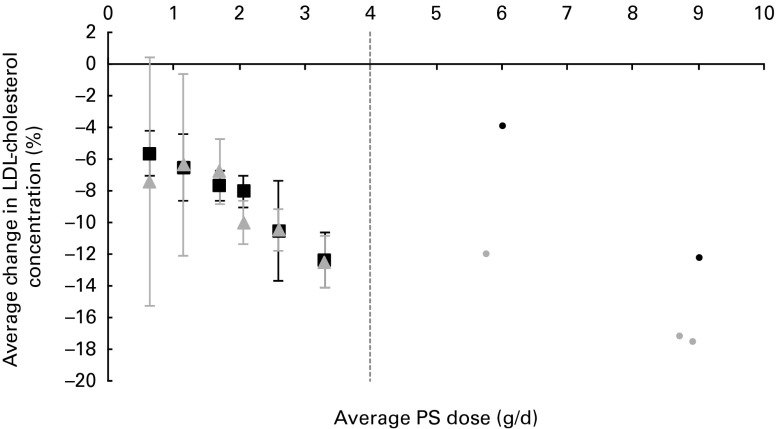
Fig. 2.
Average effects on LDL-cholesterol concentration for different dose ranges of
phytosterols (PS), separately for plant sterols (■) and plant stanols
( ). The ● represent outcomes of single high-dose studies that
were not pooled as these were scarce and scattered across a wide range of doses.
Values are means, with 95 % CI represented by vertical bars.

